 中文
中文  Русский
 English
 Bahasa Indonesia
 Bahasa Malay
 ไทย
ไทย Español
 Deutsch
 Български
 Français
 Tiếng Việt
 বাংলা
বাংলা हिन्दी
 Čeština
 Українська
 Română
FX.co ★ Patterns #INTC | Intel Corporation Stock Price

#INTC M5
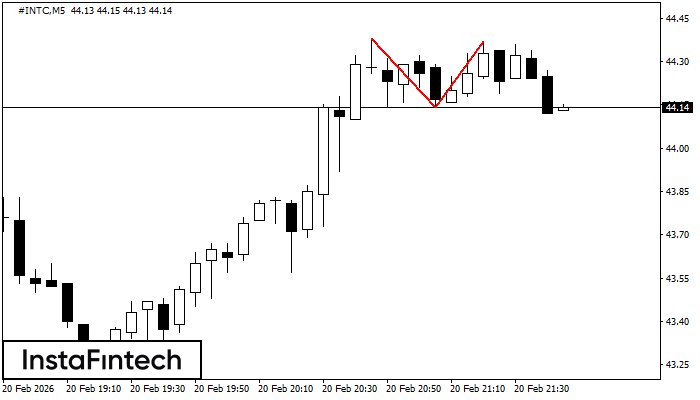
Double Top
The Double Top reversal pattern has been formed on #INTC M5. Characteristics: the upper boundary 44.38; the lower boundary 44.14; the width of the pattern is 23 points. Sell trades are better to be opened below the lower boundary 44.14 with a possible movements towards the 43.99 level.
#INTC M15
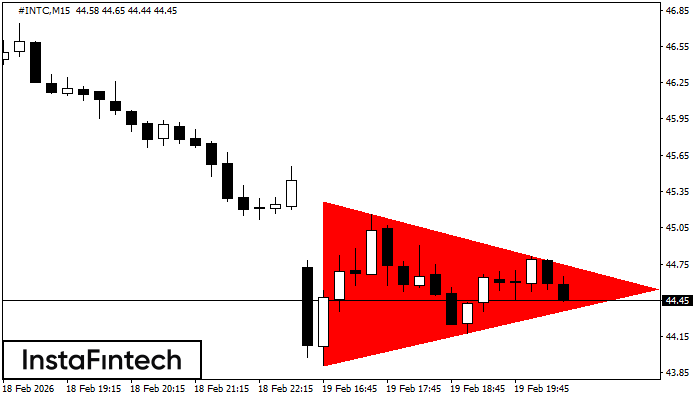
Bearish Symmetrical Triangle
According to the chart of M15, #INTC formed the Bearish Symmetrical Triangle pattern. Description: The lower border is 43.91/44.54 and upper border is 45.27/44.54. The pattern width is measured on the chart at -136 pips. The formation of the Bearish Symmetrical Triangle pattern evidently signals a continuation of the downward trend. In other words, if the scenario comes true and #INTC breaches the lower border, the price could continue its move toward 44.31.
#INTC M5
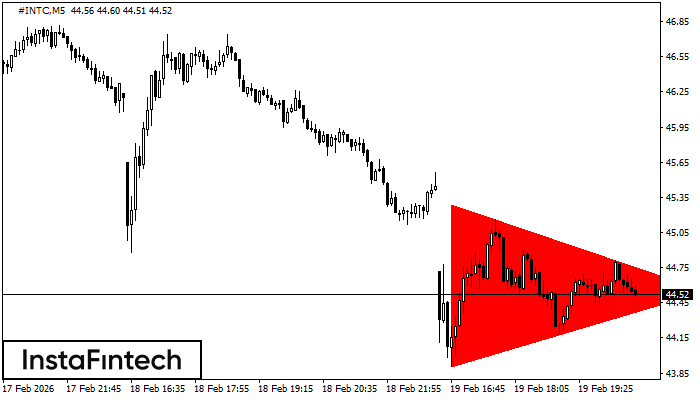
Bearish Symmetrical Triangle
According to the chart of M5, #INTC formed the Bearish Symmetrical Triangle pattern. Description: The lower border is 43.91/44.55 and upper border is 45.29/44.55. The pattern width is measured on the chart at -138 pips. The formation of the Bearish Symmetrical Triangle pattern evidently signals a continuation of the downward trend. In other words, if the scenario comes true and #INTC breaches the lower border, the price could continue its move toward 44.40.
#INTC M5
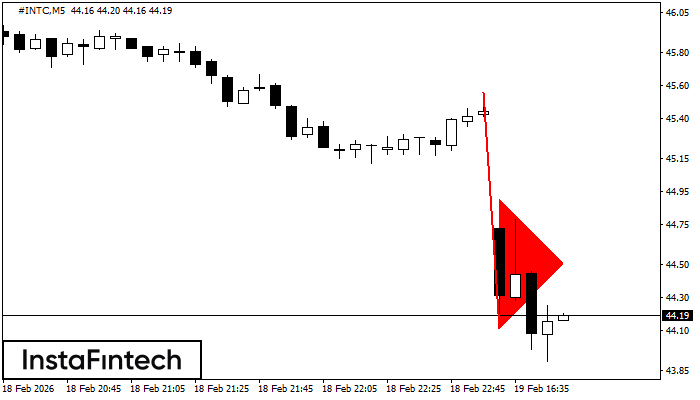
Bearish pennant
The Bearish pennant pattern has formed on the #INTC M5 chart. This pattern type is characterized by a slight slowdown after which the price will move in the direction of the original trend. In case the price fixes below the pattern’s low of 44.11, a trader will be able to successfully enter the sell position.
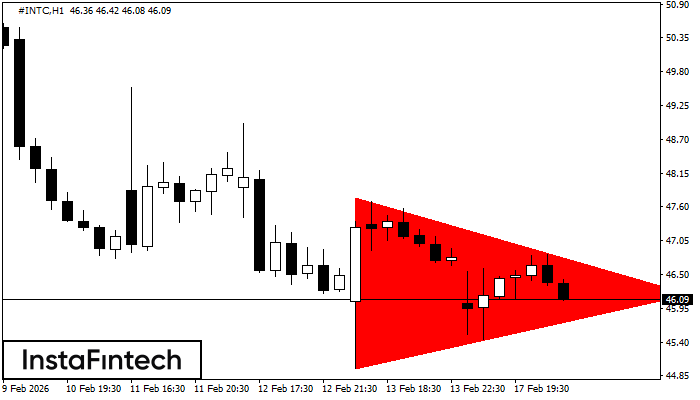
#INTC H1
Bearish Symmetrical Triangle
According to the chart of H1, #INTC formed the Bearish Symmetrical Triangle pattern. Description: The lower border is 44.97/46.17 and upper border is 47.76/46.17. The pattern width is measured on the chart at -279 pips. The formation of the Bearish Symmetrical Triangle pattern evidently signals a continuation of the downward trend. In other words, if the scenario comes true and #INTC breaches the lower border, the price could continue its move toward 45.77.
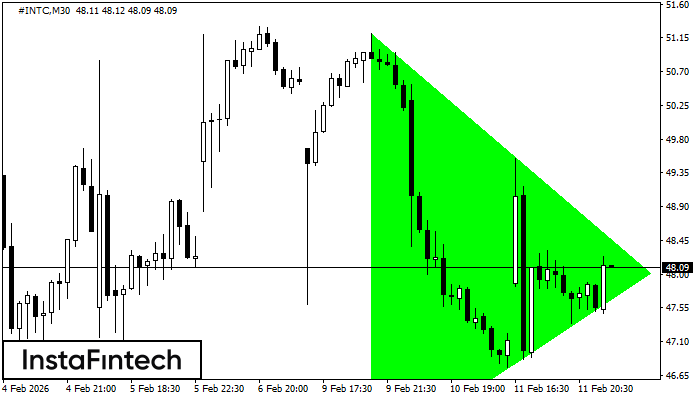
#INTC M30
Bullish Symmetrical Triangle
According to the chart of M30, #INTC formed the Bullish Symmetrical Triangle pattern, which signals the trend will continue. Description. The upper border of the pattern touches the coordinates 51.21/48.01 whereas the lower border goes across 45.53/48.01. The pattern width is measured on the chart at 568 pips. If the Bullish Symmetrical Triangle pattern is in progress during the upward trend, this indicates the current trend will go on. In case 48.01 is broken, the price could continue its move toward 48.31.
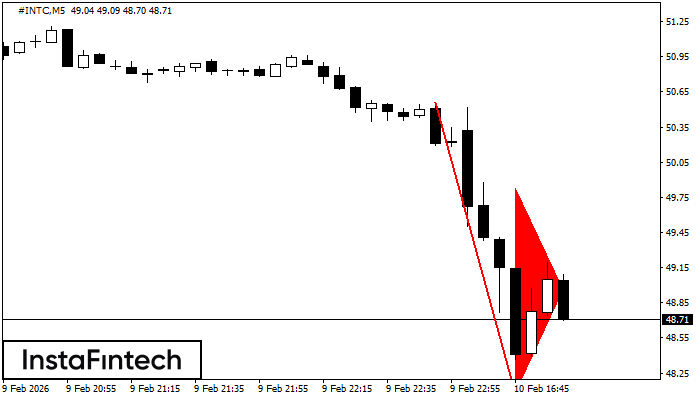
#INTC M5
Bearish pennant
The Bearish pennant pattern has formed on the #INTC M5 chart. This pattern type is characterized by a slight slowdown after which the price will move in the direction of the original trend. In case the price fixes below the pattern’s low of 48.08, a trader will be able to successfully enter the sell position.
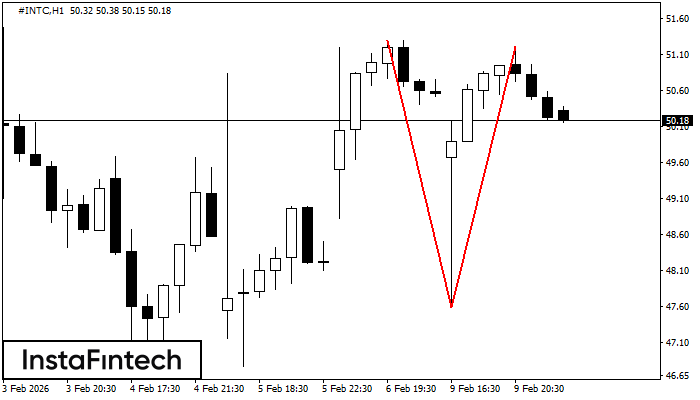
#INTC H1
Double Top
The Double Top pattern has been formed on #INTC H1. It signals that the trend has been changed from upwards to downwards. Probably, if the base of the pattern 47.59 is broken, the downward movement will continue.
#INTC M30
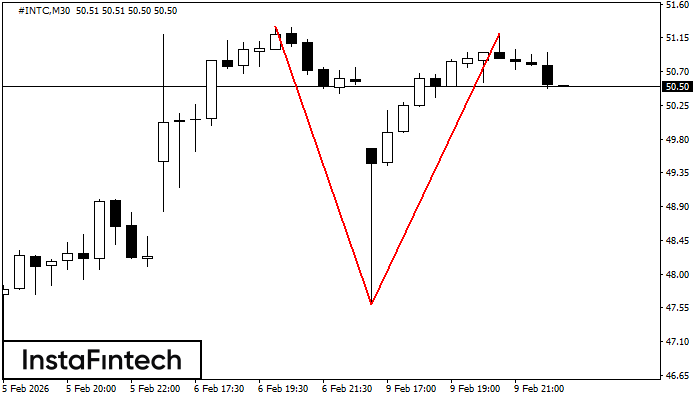
Double Top
The Double Top pattern has been formed on #INTC M30. It signals that the trend has been changed from upwards to downwards. Probably, if the base of the pattern 47.59 is broken, the downward movement will continue.
#INTC M5
Head and Shoulders
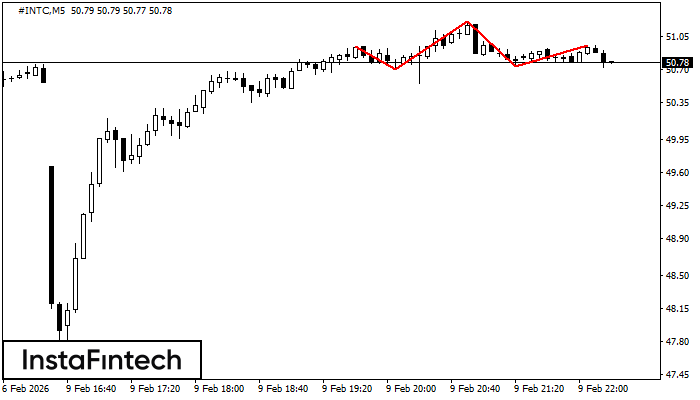
According to the chart of M5, #INTC formed the Head and Shoulders pattern. The Head’s top is set at 51.21 while the median line of the Neck is found at 50.70/50.73. The formation of the Head and Shoulders pattern evidently signals a reversal of the upward trend. In other words, in case the scenario comes true, the price of #INTC will go towards 50.58.