 中文
中文  Русский
 English
 Bahasa Indonesia
 Bahasa Malay
 ไทย
ไทย Español
 Deutsch
 Български
 Français
 Tiếng Việt
 বাংলা
বাংলা हिन्दी
 Čeština
 Українська
 Română
FX.co ★ Patterns GOLD | Gold Rate in the Forex market

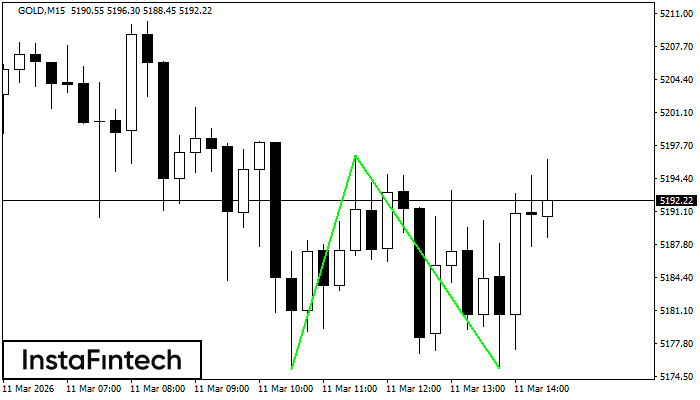
GOLD M15
Double Bottom
The Double Bottom pattern has been formed on GOLD M15. This formation signals a reversal of the trend from downwards to upwards. The signal is that a buy trade should be opened after the upper boundary of the pattern 5196.70 is broken. The further movements will rely on the width of the current pattern 2157 points.
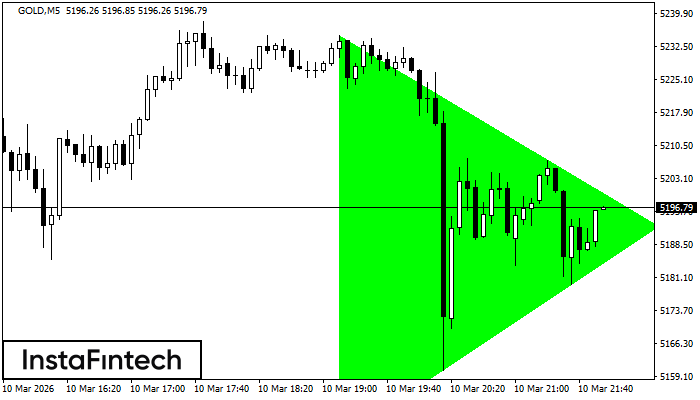
GOLD M5
Bullish Symmetrical Triangle
According to the chart of M5, GOLD formed the Bullish Symmetrical Triangle pattern. The lower border of the pattern touches the coordinates 5145.00/5192.38 whereas the upper border goes across 5234.93/5192.38. If the Bullish Symmetrical Triangle pattern is in progress, this evidently signals a further upward trend. In other words, in case the scenario comes true, the price of GOLD will breach the upper border to head for 5192.53.
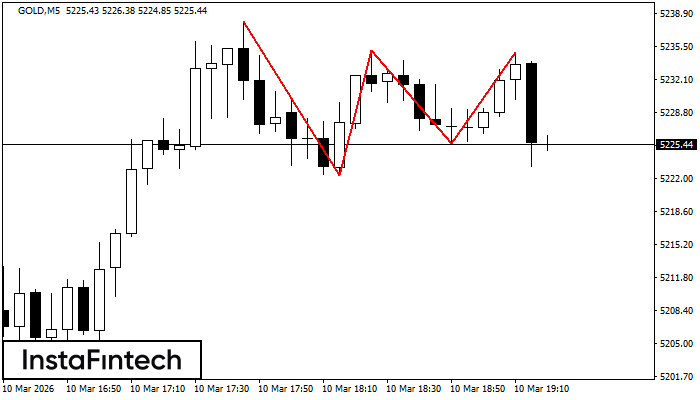
GOLD M5
Triple Top
The Triple Top pattern has formed on the chart of the GOLD M5. Features of the pattern: borders have an ascending angle; the lower line of the pattern has the coordinates 5222.28/5225.56 with the upper limit 5238.09/5234.93; the projection of the width is 1581 points. The formation of the Triple Top figure most likely indicates a change in the trend from upward to downward. This means that in the event of a breakdown of the support level of 5222.28, the price is most likely to continue the downward movement.
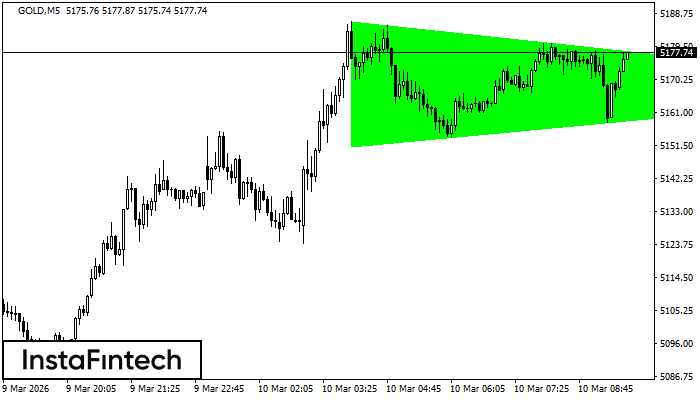
GOLD M5
Bullish Symmetrical Triangle
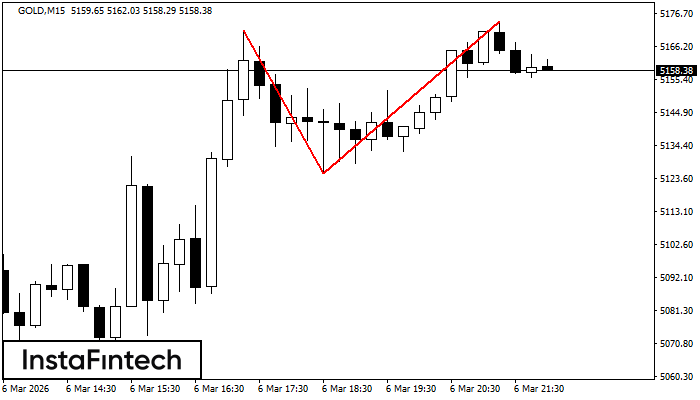
According to the chart of M5, GOLD formed the Bullish Symmetrical Triangle pattern. Description: This is the pattern of a trend continuation. 5186.41 and 5151.42 are the coordinates of the upper and lower borders respectively. The pattern width is measured on the chart at 3499 pips. Outlook: If the upper border 5186.41 is broken, the price is likely to continue its move by 5167.84.
GOLD M15
Triple Top
On the chart of the GOLD M15 trading instrument, the Triple Top pattern that signals a trend change has formed. It is possible that after formation of the third peak, the price will try to break through the resistance level 5125.47, where we advise to open a trading position for sale. Take profit is the projection of the pattern’s width, which is 4560 points.
GOLD M5
Double Top
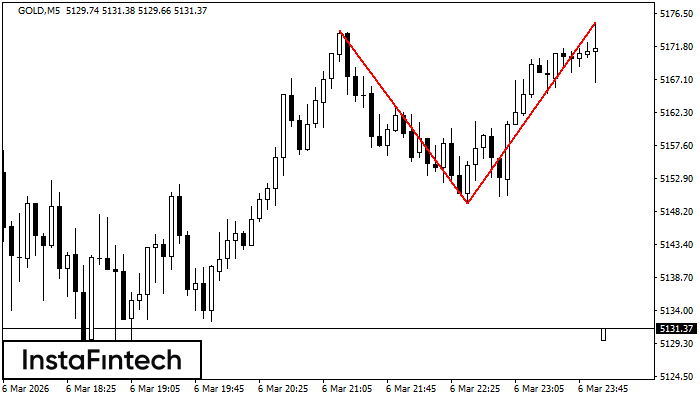
On the chart of GOLD M5 the Double Top reversal pattern has been formed. Characteristics: the upper boundary 5175.32; the lower boundary 5149.29; the width of the pattern 2603 points. The signal: a break of the lower boundary will cause continuation of the downward trend targeting the 5149.14 level.
GOLD M15
Double Top
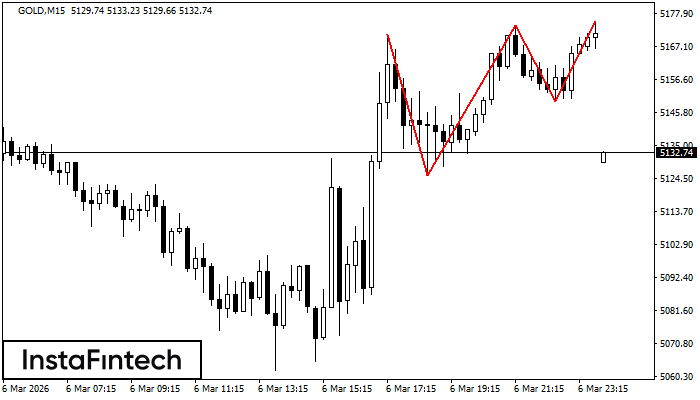
On the chart of GOLD M15 the Double Top reversal pattern has been formed. Characteristics: the upper boundary 5174.08; the lower boundary 5125.47; the width of the pattern 4861 points. The signal: a break of the lower boundary will cause continuation of the downward trend targeting the 5125.25 level.
GOLD M5
Inverse Head and Shoulder
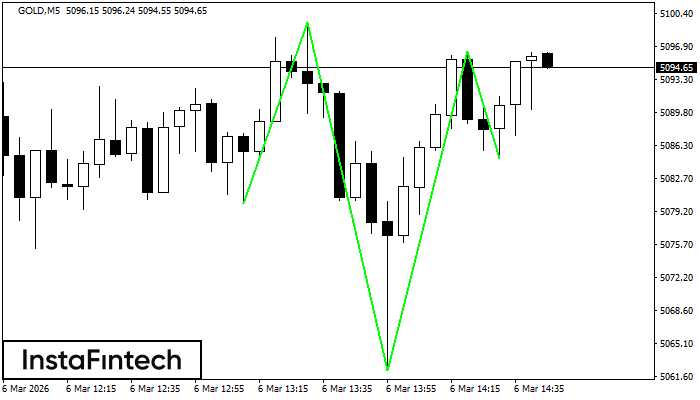
According to the chart of M5, GOLD produced the pattern termed the Inverse Head and Shoulder. The Head is fixed at 5062.26 while the median line of the Neck is set at 5099.47/5096.27. The formation of the Inverse Head and Shoulder Pattern clearly indicates a reversal of the downward trend. In means that in case the scenario comes true, the price of GOLD will go towards 5096.42.
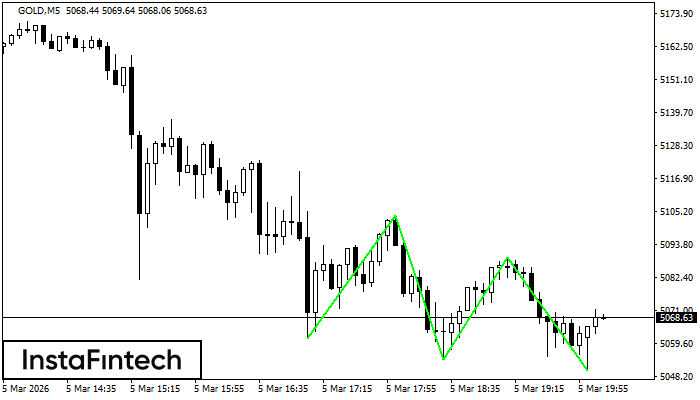
GOLD M5
Triple Bottom
The Triple Bottom pattern has formed on the chart of the GOLD M5 trading instrument. The pattern signals a change in the trend from downwards to upwards in the case of breakdown of 5104.15/5089.34.
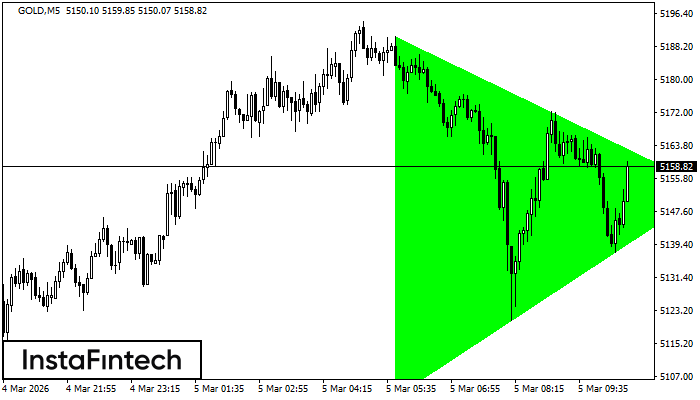
GOLD M5
Bullish Symmetrical Triangle
According to the chart of M5, GOLD formed the Bullish Symmetrical Triangle pattern. The lower border of the pattern touches the coordinates 5101.92/5153.04 whereas the upper border goes across 5190.82/5153.04. If the Bullish Symmetrical Triangle pattern is in progress, this evidently signals a further upward trend. In other words, in case the scenario comes true, the price of GOLD will breach the upper border to head for 5153.19.