 中文
中文  Русский
 English
 Bahasa Indonesia
 Bahasa Malay
 ไทย
ไทย Español
 Deutsch
 Български
 Français
 Tiếng Việt
 বাংলা
বাংলা हिन्दी
 Čeština
 Українська
 Română
FX.co ★ Patterns AUDJPY | Australian Dollar (AUD) to Japanese Yen (JPY) Rate in the Forex market

AUDJPY M5
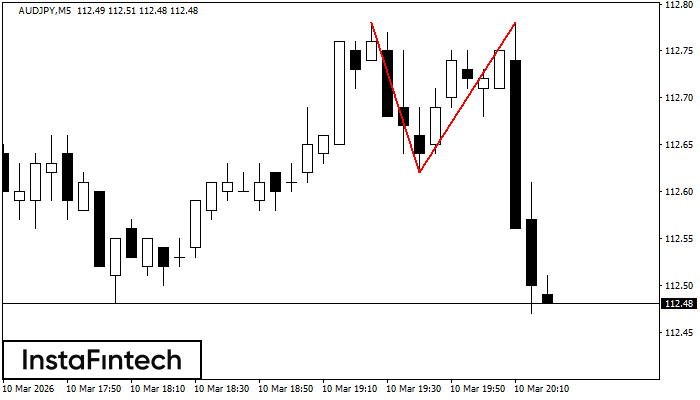
Double Top
On the chart of AUDJPY M5 the Double Top reversal pattern has been formed. Characteristics: the upper boundary 112.78; the lower boundary 112.62; the width of the pattern 16 points. The signal: a break of the lower boundary will cause continuation of the downward trend targeting the 112.47 level.
AUDJPY M5
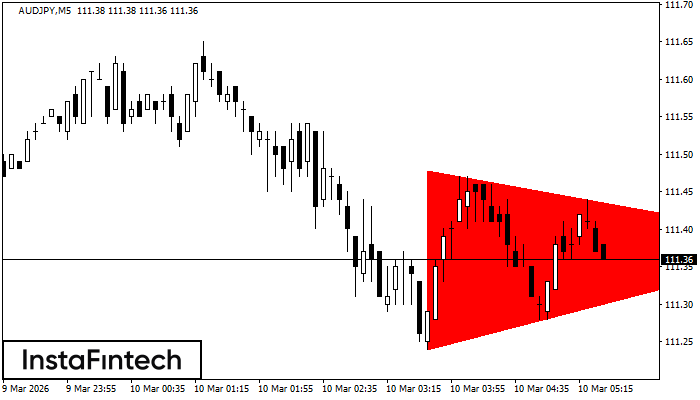
Bearish Symmetrical Triangle
According to the chart of M5, AUDJPY formed the Bearish Symmetrical Triangle pattern. Description: The lower border is 111.24/111.38 and upper border is 111.48/111.38. The pattern width is measured on the chart at -24 pips. The formation of the Bearish Symmetrical Triangle pattern evidently signals a continuation of the downward trend. In other words, if the scenario comes true and AUDJPY breaches the lower border, the price could continue its move toward 111.23.
AUDJPY M5
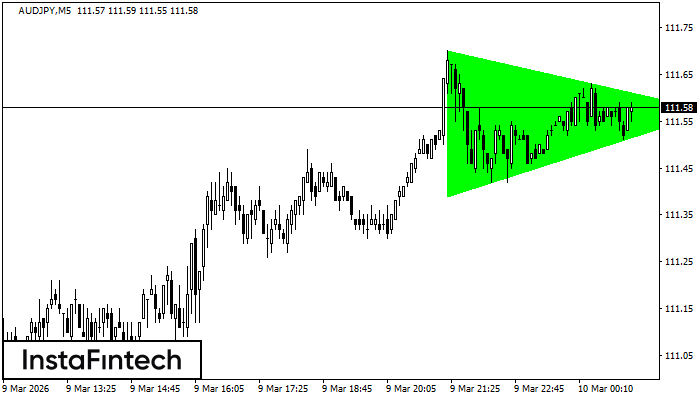
Bullish Symmetrical Triangle
According to the chart of M5, AUDJPY formed the Bullish Symmetrical Triangle pattern, which signals the trend will continue. Description. The upper border of the pattern touches the coordinates 111.70/111.57 whereas the lower border goes across 111.39/111.57. The pattern width is measured on the chart at 31 pips. If the Bullish Symmetrical Triangle pattern is in progress during the upward trend, this indicates the current trend will go on. In case 111.57 is broken, the price could continue its move toward 111.72.
AUDJPY M30
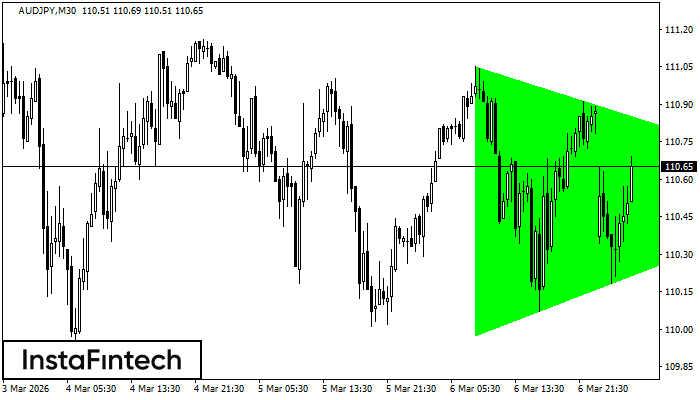
Bullish Symmetrical Triangle
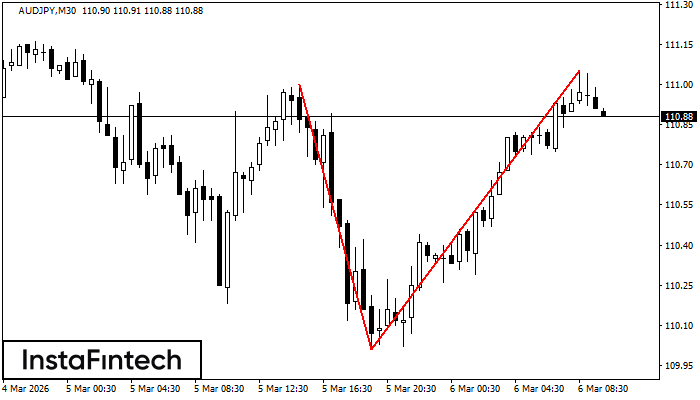
According to the chart of M30, AUDJPY formed the Bullish Symmetrical Triangle pattern, which signals the trend will continue. Description. The upper border of the pattern touches the coordinates 111.05/110.56 whereas the lower border goes across 109.97/110.56. The pattern width is measured on the chart at 108 pips. If the Bullish Symmetrical Triangle pattern is in progress during the upward trend, this indicates the current trend will go on. In case 110.56 is broken, the price could continue its move toward 110.86.
AUDJPY M5
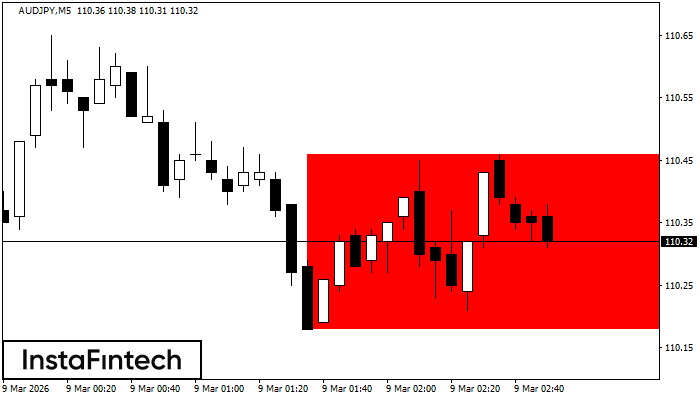
Bearish Rectangle
According to the chart of M5, AUDJPY formed the Bearish Rectangle. This type of a pattern indicates a trend continuation. It consists of two levels: resistance 110.46 - 0.00 and support 110.18 – 110.18. In case the resistance level 110.18 - 110.18 is broken, the instrument is likely to follow the bearish trend.
AUDJPY M5
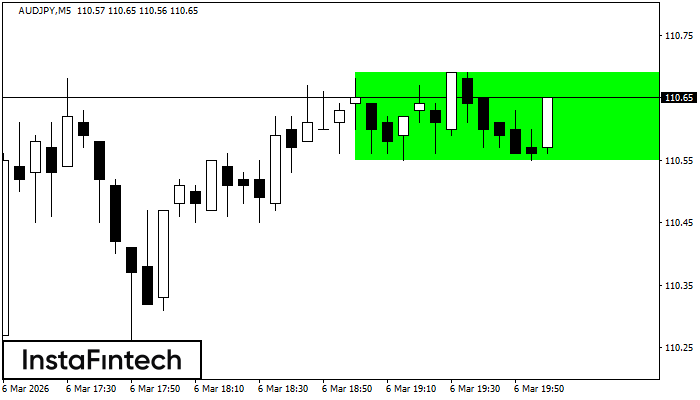
Bullish Rectangle
According to the chart of M5, AUDJPY formed the Bullish Rectangle. The pattern indicates a trend continuation. The upper border is 110.69, the lower border is 110.55. The signal means that a long position should be opened above the upper border 110.69 of the Bullish Rectangle.
AUDJPY M5
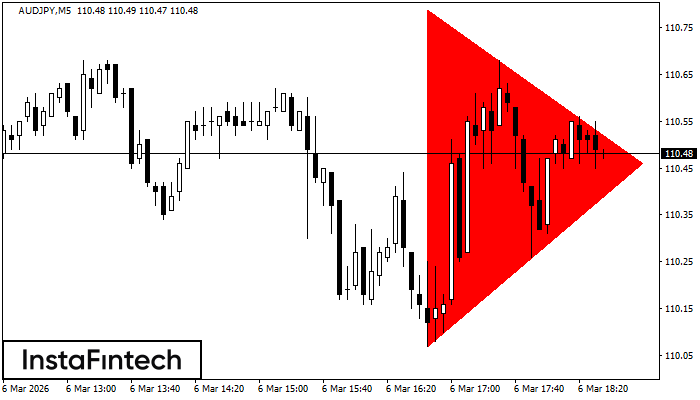
Bearish Symmetrical Triangle
According to the chart of M5, AUDJPY formed the Bearish Symmetrical Triangle pattern. This pattern signals a further downward trend in case the lower border 110.07 is breached. Here, a hypothetical profit will equal the width of the available pattern that is -72 pips.
AUDJPY M30
Double Top
On the chart of AUDJPY M30 the Double Top reversal pattern has been formed. Characteristics: the upper boundary 111.05; the lower boundary 110.01; the width of the pattern 104 points. The signal: a break of the lower boundary will cause continuation of the downward trend targeting the 109.71 level.
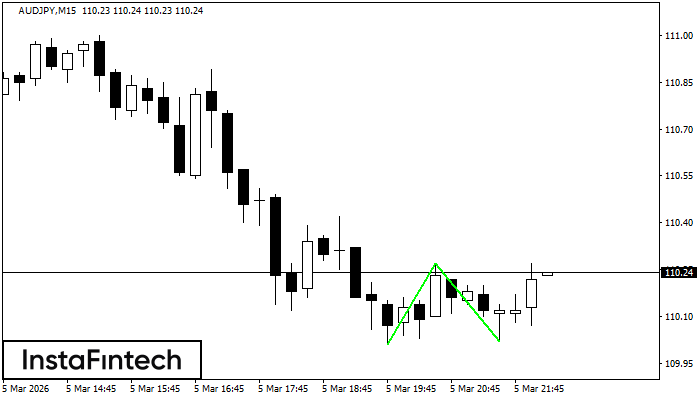
AUDJPY M15
Double Bottom
The Double Bottom pattern has been formed on AUDJPY M15; the upper boundary is 110.27; the lower boundary is 110.02. The width of the pattern is 26 points. In case of a break of the upper boundary 110.27, a change in the trend can be predicted where the width of the pattern will coincide with the distance to a possible take profit level.
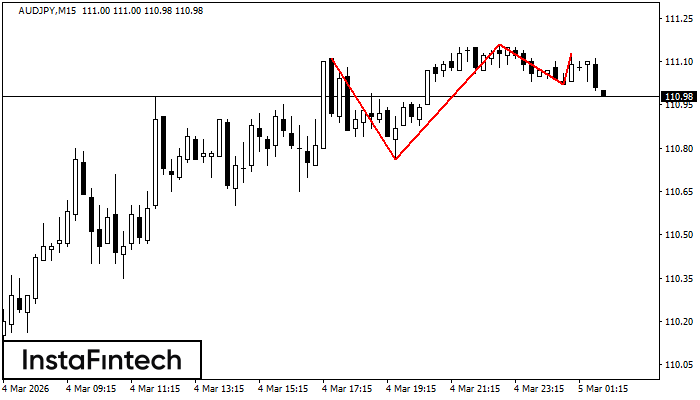
AUDJPY M15
Triple Top
The Triple Top pattern has formed on the chart of the AUDJPY M15 trading instrument. It is a reversal pattern featuring the following characteristics: resistance level -2, support level -26, and pattern’s width 35. Forecast If the price breaks through the support level 110.76, it is likely to move further down to 110.93.