 中文
中文  Русский
 English
 Bahasa Indonesia
 Bahasa Malay
 ไทย
ไทย Español
 Deutsch
 Български
 Français
 Tiếng Việt
 বাংলা
বাংলা हिन्दी
 Čeština
 Українська
 Română
FX.co ★ Patterns AUDCHF | Australian Dollar (AUD) to Swiss Franc (CHF) Rate in the Forex market

AUDCHF M15
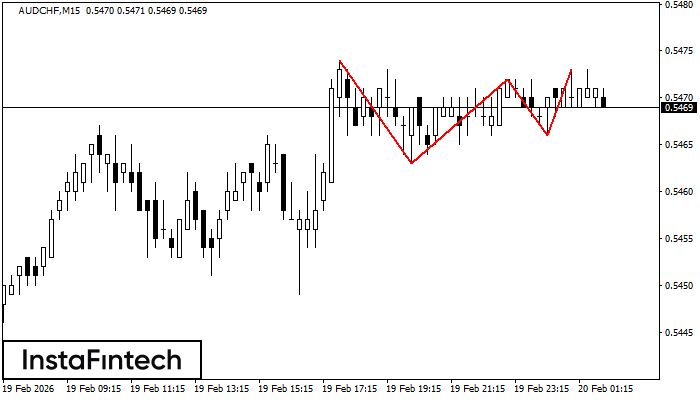
Triple Top
On the chart of the AUDCHF M15 trading instrument, the Triple Top pattern that signals a trend change has formed. It is possible that after formation of the third peak, the price will try to break through the resistance level 0.5463, where we advise to open a trading position for sale. Take profit is the projection of the pattern’s width, which is 11 points.
AUDCHF M15
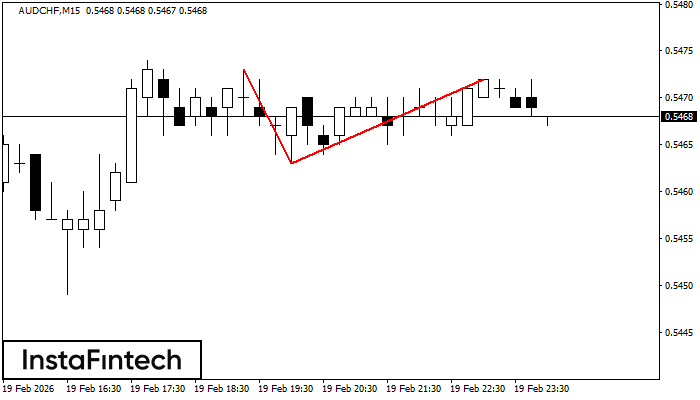
Double Top
The Double Top reversal pattern has been formed on AUDCHF M15. Characteristics: the upper boundary 0.5473; the lower boundary 0.5463; the width of the pattern is 9 points. Sell trades are better to be opened below the lower boundary 0.5463 with a possible movements towards the 0.5440 level.
AUDCHF M5
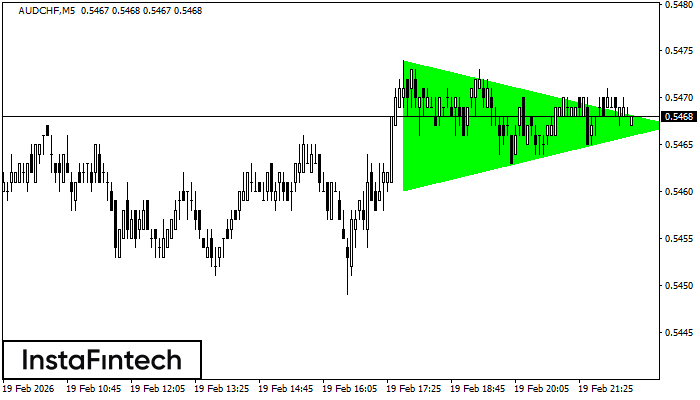
Bullish Symmetrical Triangle
According to the chart of M5, AUDCHF formed the Bullish Symmetrical Triangle pattern. The lower border of the pattern touches the coordinates 0.5460/0.5467 whereas the upper border goes across 0.5474/0.5467. If the Bullish Symmetrical Triangle pattern is in progress, this evidently signals a further upward trend. In other words, in case the scenario comes true, the price of AUDCHF will breach the upper border to head for 0.5482.
AUDCHF M15
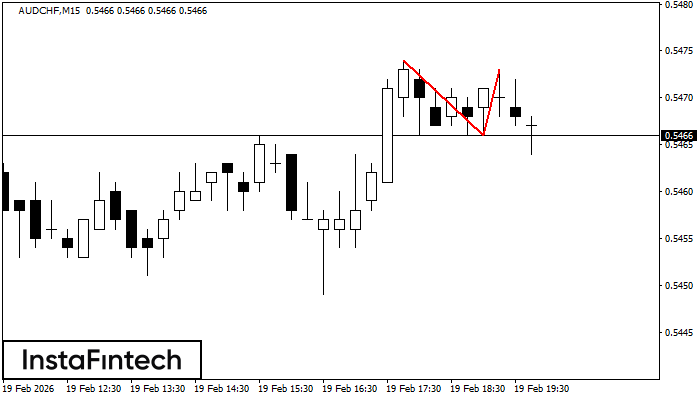
Double Top
On the chart of AUDCHF M15 the Double Top reversal pattern has been formed. Characteristics: the upper boundary 0.5473; the lower boundary 0.5466; the width of the pattern 7 points. The signal: a break of the lower boundary will cause continuation of the downward trend targeting the 0.5444 level.
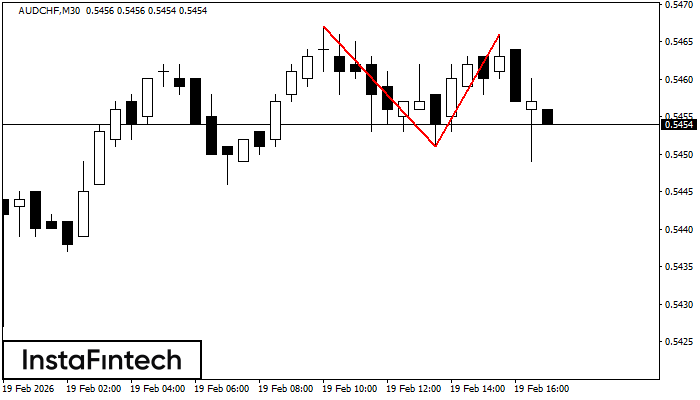
AUDCHF M30
Double Top
The Double Top reversal pattern has been formed on AUDCHF M30. Characteristics: the upper boundary 0.5467; the lower boundary 0.5451; the width of the pattern is 15 points. Sell trades are better to be opened below the lower boundary 0.5451 with a possible movements towards the 0.5421 level.
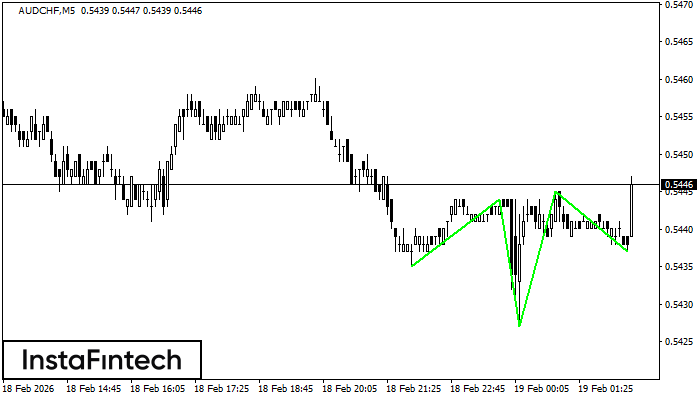
AUDCHF M5
Inverse Head and Shoulder
According to the chart of M5, AUDCHF formed the Inverse Head and Shoulder pattern. The Head’s top is set at 0.5445 while the median line of the Neck is found at 0.5427/0.5437. The formation of the Inverse Head and Shoulder pattern evidently signals a reversal of the downward trend. In other words, in case the scenario comes true, the price of AUDCHF will go towards 0.5460
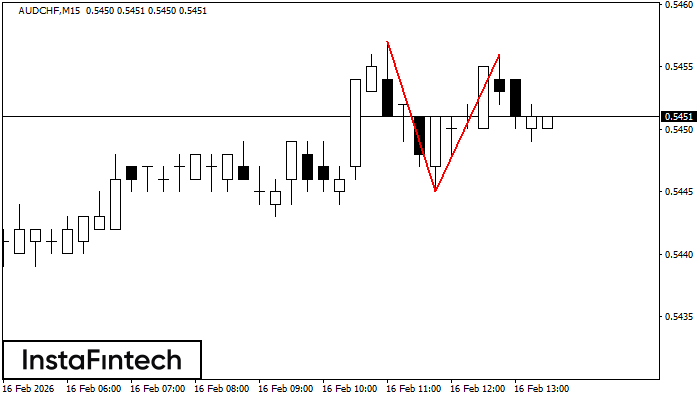
AUDCHF M15
Double Top
The Double Top reversal pattern has been formed on AUDCHF M15. Characteristics: the upper boundary 0.5457; the lower boundary 0.5445; the width of the pattern is 11 points. Sell trades are better to be opened below the lower boundary 0.5445 with a possible movements towards the 0.5422 level.
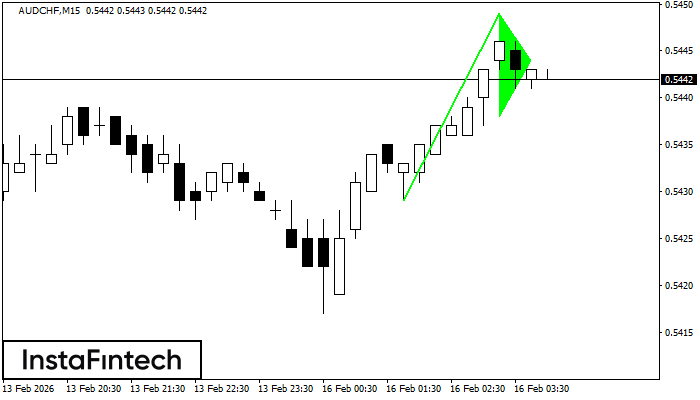
AUDCHF M15
Bullish pennant
The Bullish pennant graphic pattern has formed on the AUDCHF M15 instrument. This pattern type falls under the category of continuation patterns. In this case, if the quote can breaks out high, is expected to continue the upward trend to level 0.5472.
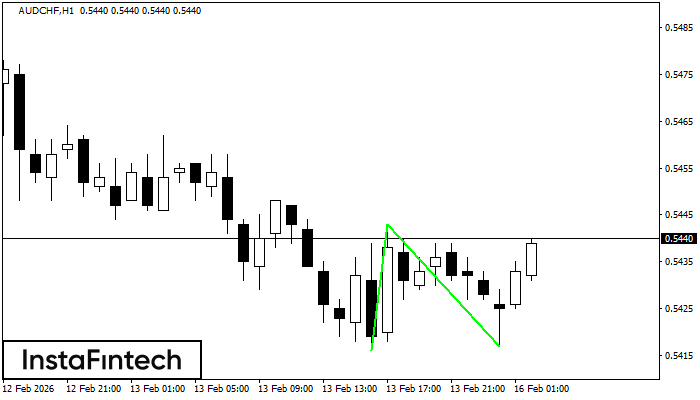
AUDCHF H1
Double Bottom
The Double Bottom pattern has been formed on AUDCHF H1; the upper boundary is 0.5443; the lower boundary is 0.5417. The width of the pattern is 27 points. In case of a break of the upper boundary 0.5443, a change in the trend can be predicted where the width of the pattern will coincide with the distance to a possible take profit level.
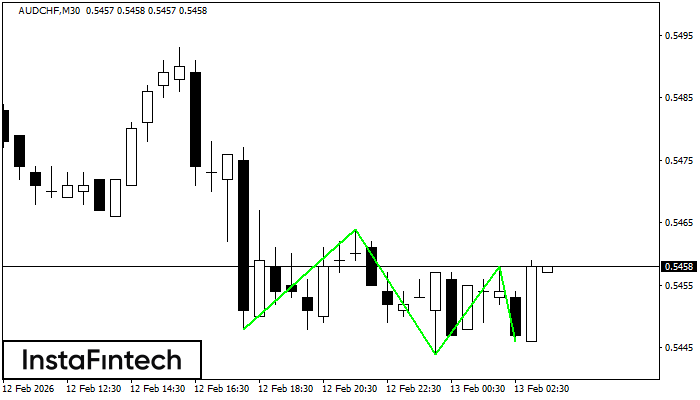
AUDCHF M30
Triple Bottom
The Triple Bottom pattern has formed on the chart of AUDCHF M30. Features of the pattern: The lower line of the pattern has coordinates 0.5464 with the upper limit 0.5464/0.5458, the projection of the width is 16 points. The formation of the Triple Bottom pattern most likely indicates a change in the trend from downward to upward. This means that in the event of a breakdown of the resistance level 0.5448, the price is most likely to continue the upward movement.