 中文
中文  Русский
 English
 Bahasa Indonesia
 Bahasa Malay
 ไทย
ไทย Español
 Deutsch
 Български
 Français
 Tiếng Việt
 বাংলা
বাংলা हिन्दी
 Čeština
 Українська
 Română
FX.co ★ Patterns #AAPL | Apple Inc. Stock Price

#AAPL M15
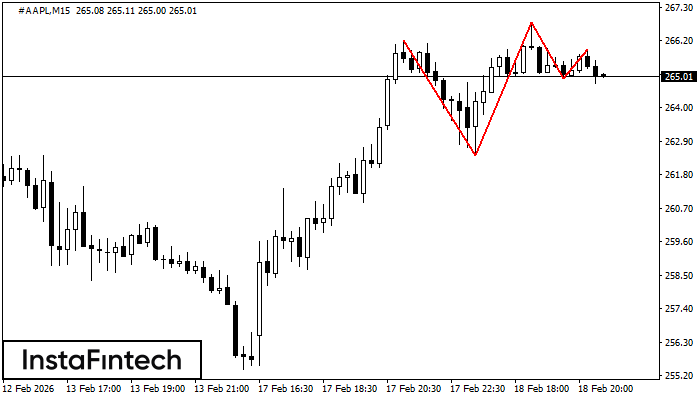
Triple Top
The Triple Top pattern has formed on the chart of the #AAPL M15. Features of the pattern: borders have an ascending angle; the lower line of the pattern has the coordinates 262.42/264.96 with the upper limit 266.21/265.91; the projection of the width is 379 points. The formation of the Triple Top figure most likely indicates a change in the trend from upward to downward. This means that in the event of a breakdown of the support level of 262.42, the price is most likely to continue the downward movement.
#AAPL M5
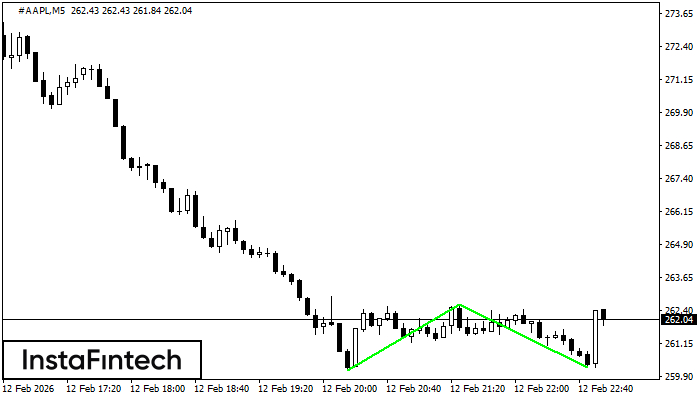
Double Bottom
The Double Bottom pattern has been formed on #AAPL M5; the upper boundary is 262.63; the lower boundary is 260.25. The width of the pattern is 249 points. In case of a break of the upper boundary 262.63, a change in the trend can be predicted where the width of the pattern will coincide with the distance to a possible take profit level.
#AAPL M5
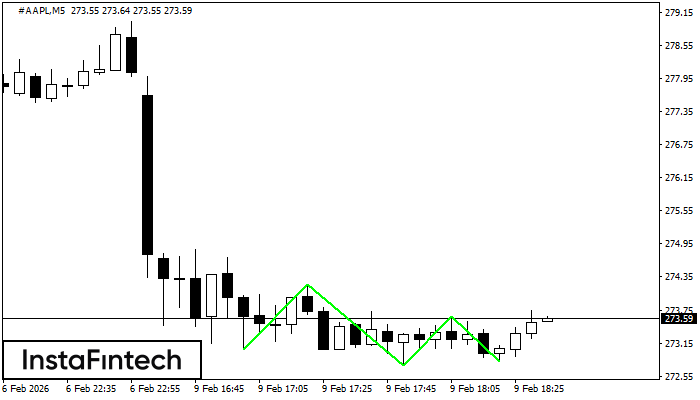
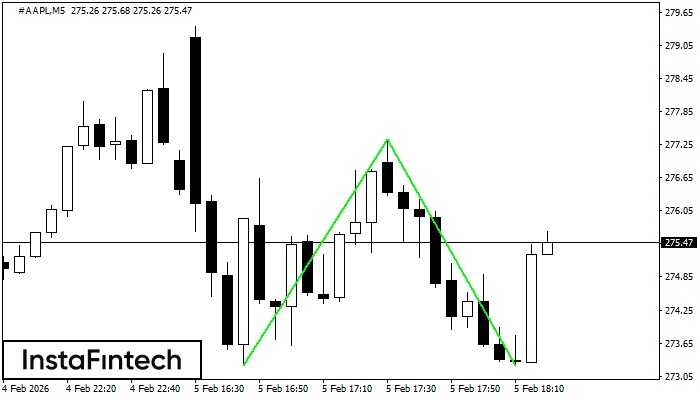
Triple Bottom
The Triple Bottom pattern has formed on the chart of #AAPL M5. Features of the pattern: The lower line of the pattern has coordinates 274.22 with the upper limit 274.22/273.64, the projection of the width is 119 points. The formation of the Triple Bottom pattern most likely indicates a change in the trend from downward to upward. This means that in the event of a breakdown of the resistance level 273.03, the price is most likely to continue the upward movement.
#AAPL M30
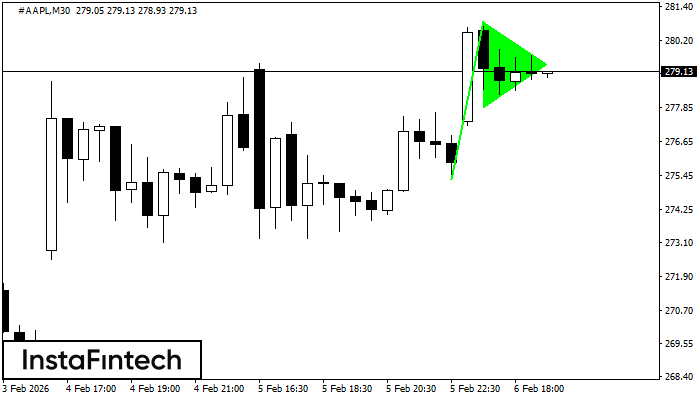
Bullish pennant
The Bullish pennant graphic pattern has formed on the #AAPL M30 instrument. This pattern type falls under the category of continuation patterns. In this case, if the quote can breaks out high, is expected to continue the upward trend to level 281.17.
#AAPL M5
Double Bottom
The Double Bottom pattern has been formed on #AAPL M5; the upper boundary is 277.34; the lower boundary is 273.25. The width of the pattern is 410 points. In case of a break of the upper boundary 277.34, a change in the trend can be predicted where the width of the pattern will coincide with the distance to a possible take profit level.
#AAPL M15
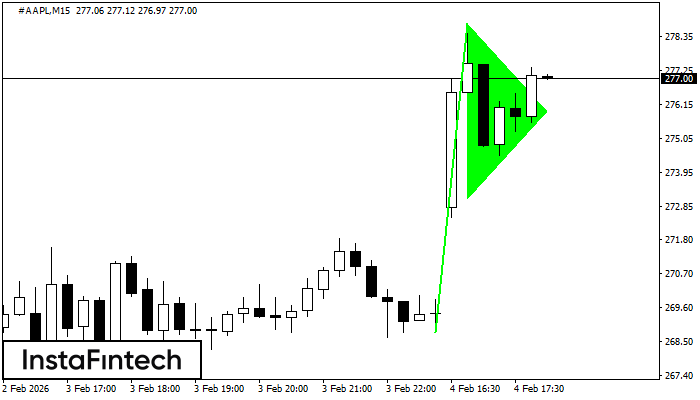
Bullish pennant
The Bullish pennant graphic pattern has formed on the #AAPL M15 instrument. This pattern type falls under the category of continuation patterns. In this case, if the quote can breaks out high, is expected to continue the upward trend to level 278.99.
#AAPL M30
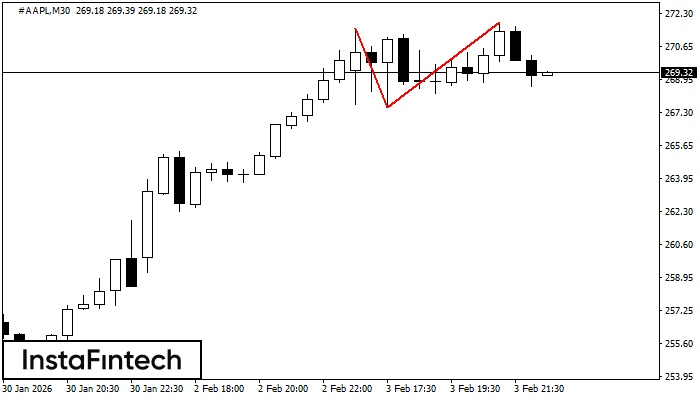
Double Top
The Double Top pattern has been formed on #AAPL M30. It signals that the trend has been changed from upwards to downwards. Probably, if the base of the pattern 267.58 is broken, the downward movement will continue.
#AAPL M5
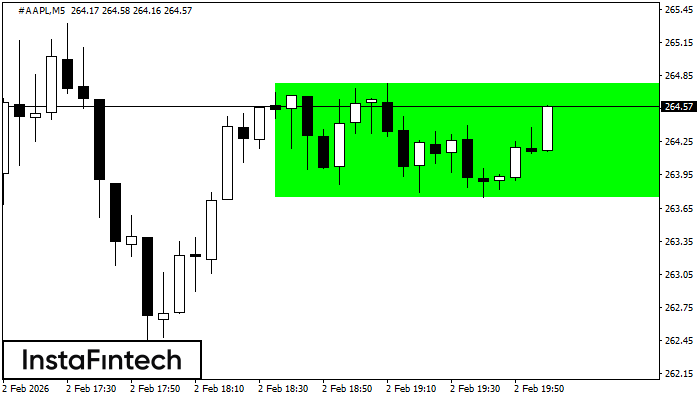
Bullish Rectangle
According to the chart of M5, #AAPL formed the Bullish Rectangle. The pattern indicates a trend continuation. The upper border is 264.78, the lower border is 263.75. The signal means that a long position should be opened above the upper border 264.78 of the Bullish Rectangle.
#AAPL M5
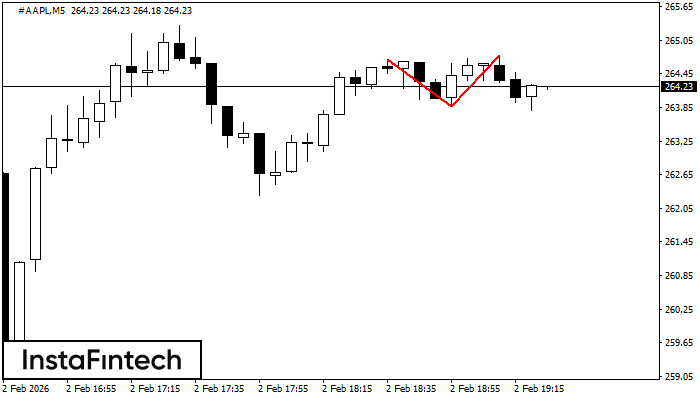
Double Top
The Double Top reversal pattern has been formed on #AAPL M5. Characteristics: the upper boundary 264.70; the lower boundary 263.86; the width of the pattern is 92 points. Sell trades are better to be opened below the lower boundary 263.86 with a possible movements towards the 263.71 level.
#AAPL M5
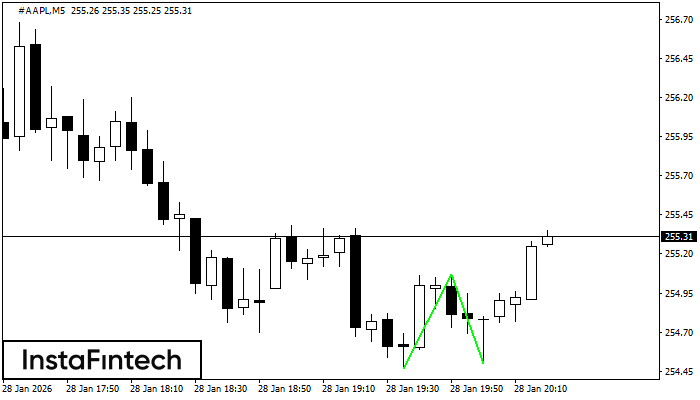
Double Bottom
The Double Bottom pattern has been formed on #AAPL M5. This formation signals a reversal of the trend from downwards to upwards. The signal is that a buy trade should be opened after the upper boundary of the pattern 255.07 is broken. The further movements will rely on the width of the current pattern 60 points.