 English
  Русский
 Bahasa Indonesia
 Bahasa Malay
 ไทย
ไทย Español
 Deutsch
 Български
 Français
 Tiếng Việt
 中文
中文 বাংলা
বাংলা हिन्दी
 Čeština
 Українська
 Română
FX.co ★ Patterns #Bitcoin | Bitcoin cryptocurrency Rate in the Forex market

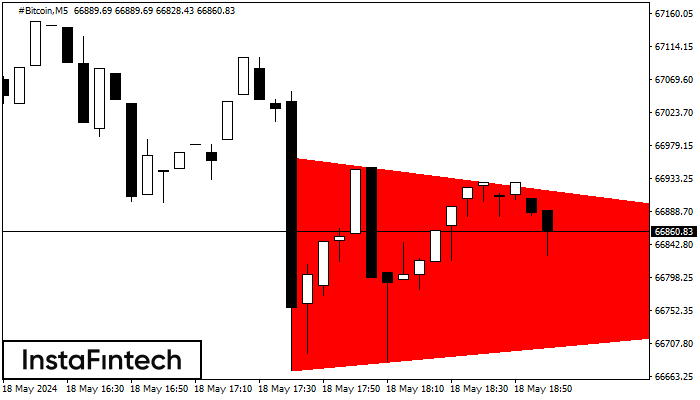
#Bitcoin M5
Bearish Symmetrical Triangle
According to the chart of M5, #Bitcoin formed the Bearish Symmetrical Triangle pattern. This pattern signals a further downward trend in case the lower border 66671.19 is breached. Here, a hypothetical profit will equal the width of the available pattern that is -29178 pips.
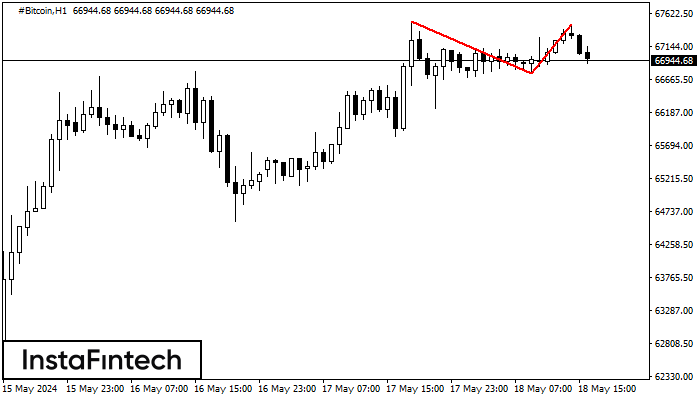
#Bitcoin H1
Double Top
On the chart of #Bitcoin H1 the Double Top reversal pattern has been formed. Characteristics: the upper boundary 67472.69; the lower boundary 66754.20; the width of the pattern 71849 points. The signal: a break of the lower boundary will cause continuation of the downward trend targeting the 66753.80 level.
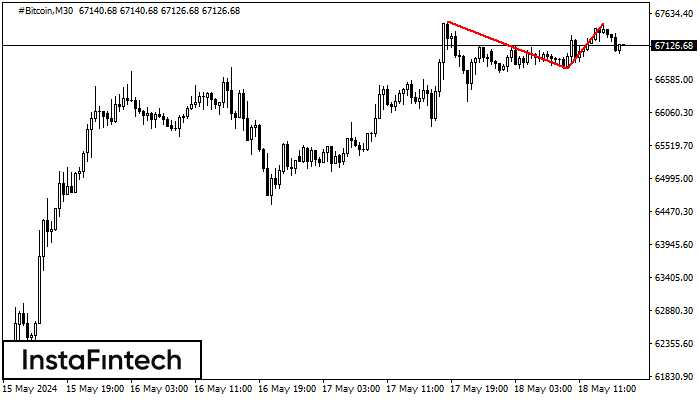
#Bitcoin M30
Double Top
The Double Top reversal pattern has been formed on #Bitcoin M30. Characteristics: the upper boundary 67511.91; the lower boundary 66754.20; the width of the pattern is 71849 points. Sell trades are better to be opened below the lower boundary 66754.20 with a possible movements towards the 66753.90 level.
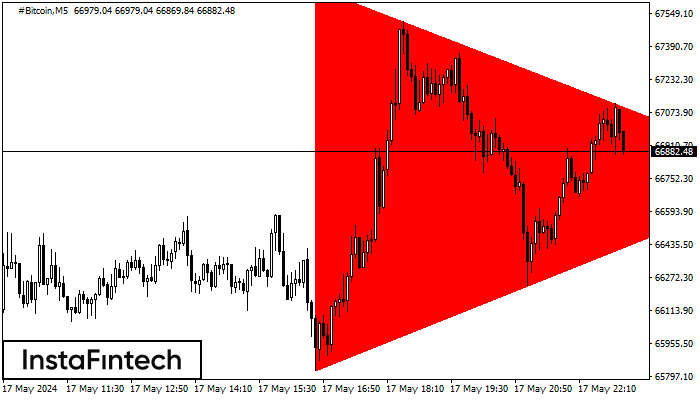
#Bitcoin M5
Bearish Symmetrical Triangle
According to the chart of M5, #Bitcoin formed the Bearish Symmetrical Triangle pattern. Trading recommendations: A breach of the lower border 65824.90 is likely to encourage a continuation of the downward trend.
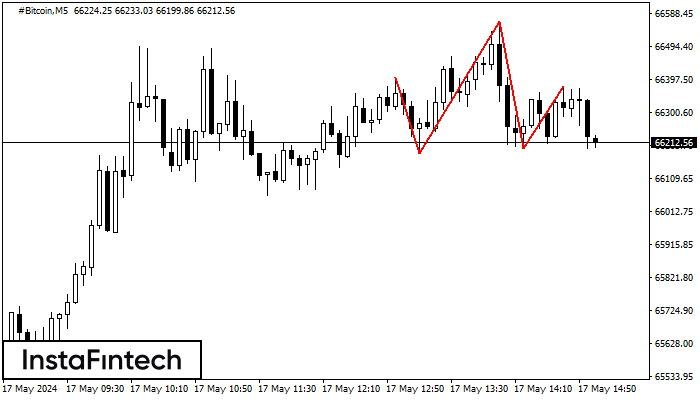
#Bitcoin M5
Head and Shoulders
According to the chart of M5, #Bitcoin formed the Head and Shoulders pattern. The Head’s top is set at 66566.18 while the median line of the Neck is found at 66180.90/66196.92. The formation of the Head and Shoulders pattern evidently signals a reversal of the upward trend. In other words, in case the scenario comes true, the price of #Bitcoin will go towards 66196.77.
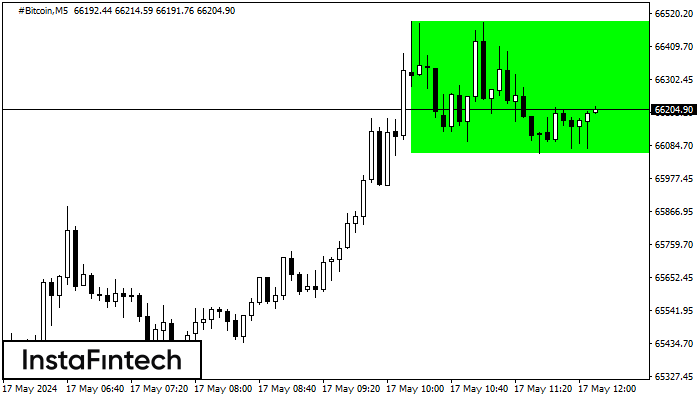
#Bitcoin M5
Bullish Rectangle
According to the chart of M5, #Bitcoin formed the Bullish Rectangle. The pattern indicates a trend continuation. The upper border is 66493.26, the lower border is 66059.77. The signal means that a long position should be opened above the upper border 66493.26 of the Bullish Rectangle.
#Bitcoin M5
Double Top
On the chart of #Bitcoin M5 the Double Top reversal pattern has been formed. Characteristics: the upper boundary 66488.31; the lower boundary 66100.16; the width of the pattern 38815 points. The signal: a break of the lower boundary will cause continuation of the downward trend targeting the 66100.01 level.
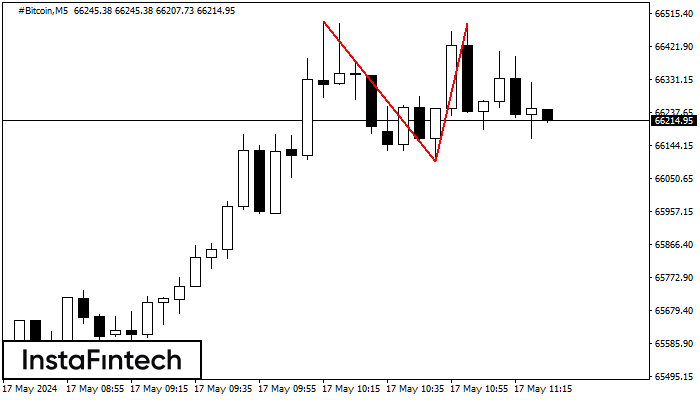
#Bitcoin M5
Bullish Symmetrical Triangle
According to the chart of M5, #Bitcoin formed the Bullish Symmetrical Triangle pattern. The lower border of the pattern touches the coordinates 65139.53/65296.39 whereas the upper border goes across 65522.75/65296.39. If the Bullish Symmetrical Triangle pattern is in progress, this evidently signals a further upward trend. In other words, in case the scenario comes true, the price of #Bitcoin will breach the upper border to head for 65296.54.
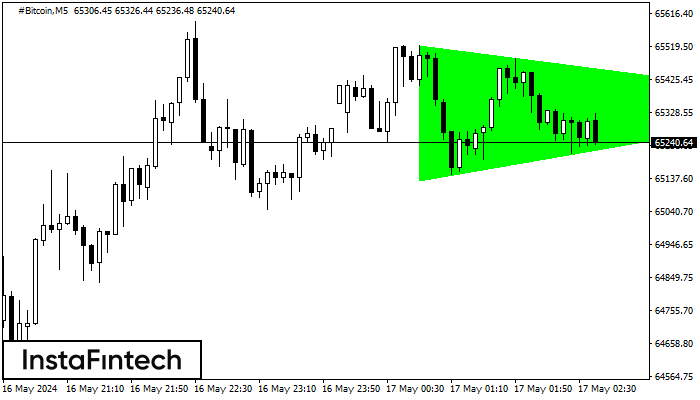
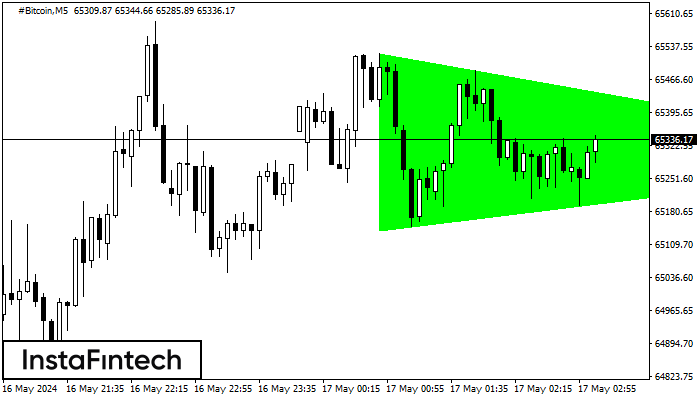
#Bitcoin M5
Bullish Symmetrical Triangle
According to the chart of M5, #Bitcoin formed the Bullish Symmetrical Triangle pattern. The lower border of the pattern touches the coordinates 65132.02/65353.69 whereas the upper border goes across 65522.75/65353.69. If the Bullish Symmetrical Triangle pattern is in progress, this evidently signals a further upward trend. In other words, in case the scenario comes true, the price of #Bitcoin will breach the upper border to head for 65353.84.
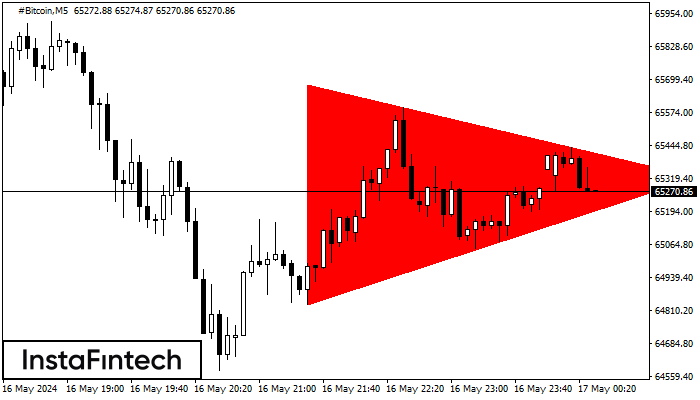
#Bitcoin M5
Bearish Symmetrical Triangle
According to the chart of M5, #Bitcoin formed the Bearish Symmetrical Triangle pattern. This pattern signals a further downward trend in case the lower border 64836.25 is breached. Here, a hypothetical profit will equal the width of the available pattern that is -84517 pips.