 Slovenský
  Русский
 English
 Bahasa Indonesia
 Bahasa Malay
 ไทย
ไทย Español
 Deutsch
 Български
 Français
 Tiếng Việt
 中文
中文 বাংলা
বাংলা हिन्दी
 Čeština
 Українська
 Română

Analyzing Thursday's trades:
EUR/USD on 1H chart
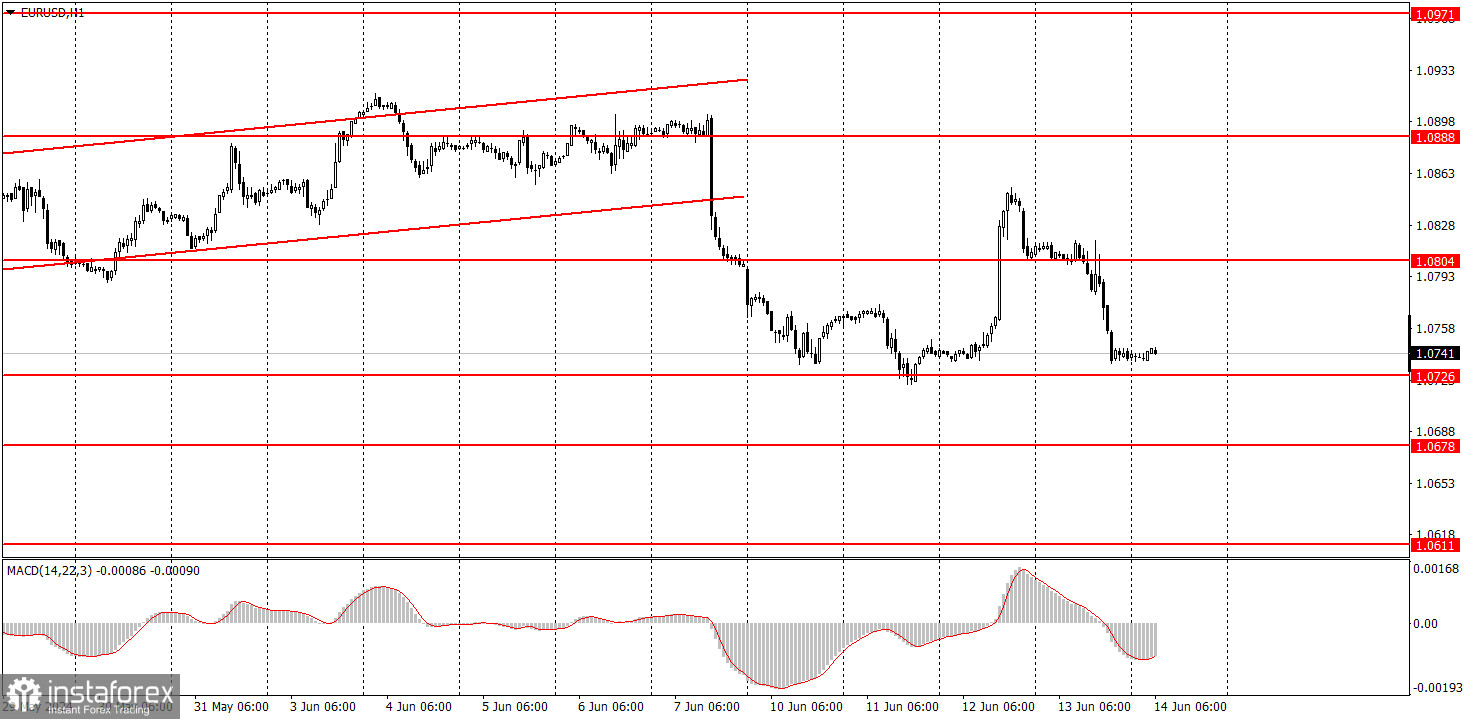
Yesterday, EUR/USD spent half of the day in a standstill and the other half moving downwards. It was quite difficult to explain why the dollar traded higher. On Wednesday, a mediocre U.S. inflation report triggered a strong drop in the greenback. Conversely, the Federal Reserve meeting only managed to provide minor support to the U.S. currency, although its results were considered hawkish. As a result, the dollar exhibited both a sharp decline and a small growth. Therefore, the market only rectified the situation on Thursday. In addition, a global downward trend persists on the 24-hour timeframe. The pair left the ascending channel on the hourly TF, so the current technical picture fully supports further downward movement for the pair. There is currently almost no correlation between the euro and the pound, so the British currency may continue to trade on its own terms.
EUR/USD on 5M chart
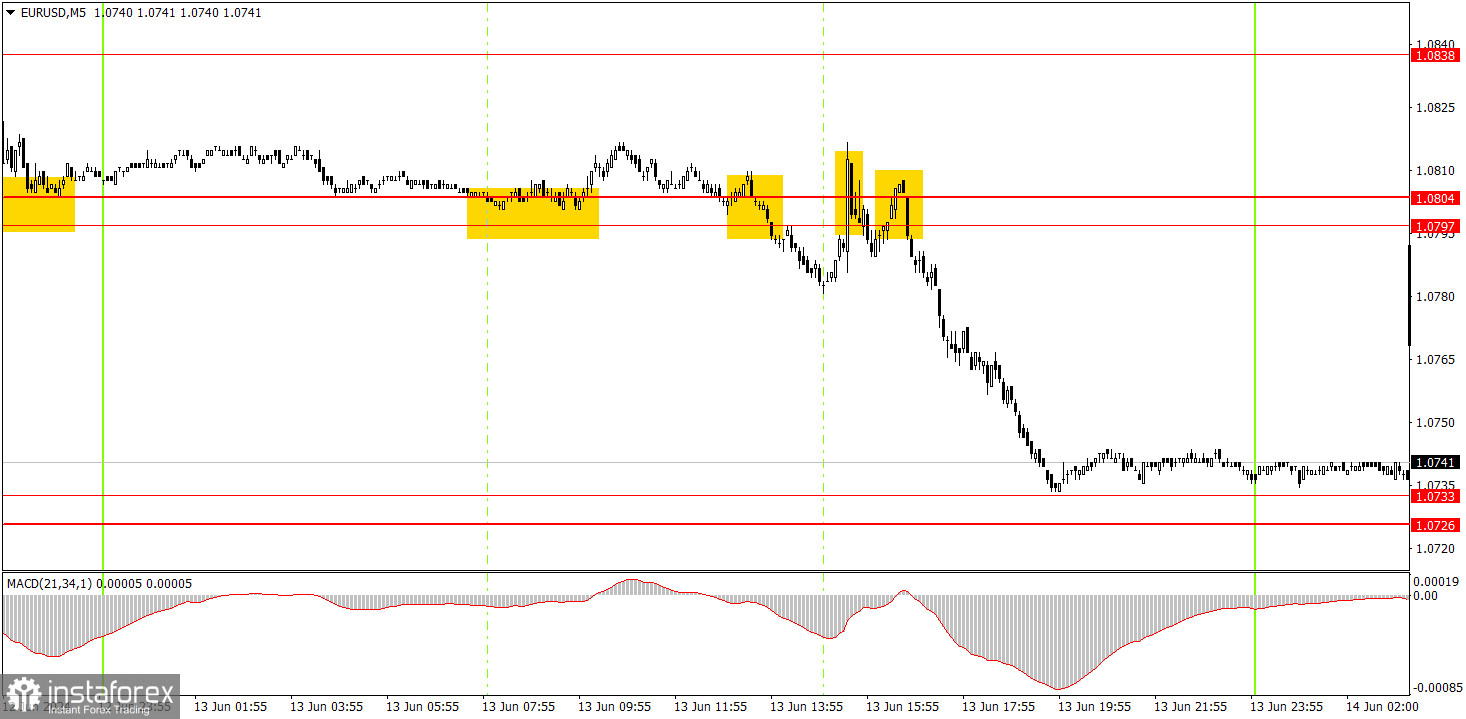
Four trading signals were formed around the 1.0797-1.0804 area on the 5-minute TF. Unfortunately, the pair was nearly flat in the first half of the day, and at the beginning of the U.S. session, it tried to start a new upward movement after the release of the Producer Price Index. However, the market was unable to push for another illogical rise for the second consecutive day, so the price eventually started to fall. By the end of the day, the EUR/USD worked through the 1.0733 level. It was quite difficult to predict this decline based on the signals.
Trading tips on Friday:
On the hourly chart, EUR/USD is finally in the process of forming a local downward trend. The downtrend remains intact, but it is unlikely for the dollar to rise every day. We expect the pair to drop to levels 1.0600, 1.0450, and even 1.0200. However, it is important to understand that the price will not reach these targets in just a couple of weeks. On the other hand, we don't see any reasons for the euro to rise either.
On Friday, traders can look for signals around the 1.0726-1.0733 area. Traders could open new short positions with 1.0678 as the target once the price consolidates below this range. You may consider longs once the price bounces from this area, but it is unlikely for the pair to show strong growth.
The key levels on the 5M chart are 1.0483, 1.0526, 1.0568, 1.0611, 1.0678, 1.0726-1.0733, 1.0797-1.0804, 1.0838-1.0856, 1.0888-1.0896, 1.0940, 1.0971-1.0981. Today, European Central Bank President Christine Lagarde will deliver a speech. However, last week, Lagarde already provided the market with all the necessary information, so it is unlikely for her to mention anything new today. The U.S. docket will feature the University of Michigan Consumer Sentiment Index. This report might provide fresh impetus, but we don't expect the market to show a strong reaction.
Basic trading rules:
1) Signal strength is determined by the time taken for its formation (either a bounce or level breach). A shorter formation time indicates a stronger signal.
2) If two or more trades around a certain level are initiated based on false signals, subsequent signals from that level should be disregarded.
3) In a flat market, any currency pair can produce multiple false signals or none at all. In any case, the flat trend is not the best condition for trading.
4) Trading activities are confined between the onset of the European session and mid-way through the U.S. session, after which all open trades should be manually closed.
5) On the 30-minute timeframe, trades based on MACD signals are only advisable amidst substantial volatility and an established trend, confirmed either by a trendline or trend channel.
6) If two levels lie closely together (ranging from 5 to 15 pips apart), they should be considered as a support or resistance zone.
How to read charts:
Support and Resistance price levels can serve as targets when buying or selling. You can place Take Profit levels near them.
Red lines represent channels or trend lines, depicting the current market trend and indicating the preferable trading direction.
The MACD(14,22,3) indicator, encompassing both the histogram and signal line, acts as an auxiliary tool and can also be used as a signal source.
Significant speeches and reports (always noted in the news calendar) can profoundly influence the price dynamics. Hence, trading during their release calls for heightened caution. It may be reasonable to exit the market to prevent abrupt price reversals against the prevailing trend.
Beginners should always remember that not every trade will yield profit. Establishing a clear strategy coupled with sound money management is the cornerstone of sustained trading success.