 Slovenský
  Русский
 English
 Bahasa Indonesia
 Bahasa Malay
 ไทย
ไทย Español
 Deutsch
 Български
 Français
 Tiếng Việt
 中文
中文 বাংলা
বাংলা हिन्दी
 Čeština
 Українська
 Română

Analýza trendu (Obr. 1).
Trh by mohol vzrásť z úrovne 1,0769 (ukončenie včerajšej dennej sviečky) na úroveň 1,0796, čo je 5-dňový EMA priemer (tenká červená čiara). Po dosiahnutí tejto úrovne by mohol klesnúť na úroveň1,0737 ‒ úroveň ústupu 61,8 % (žltá bodkovaná čiara).
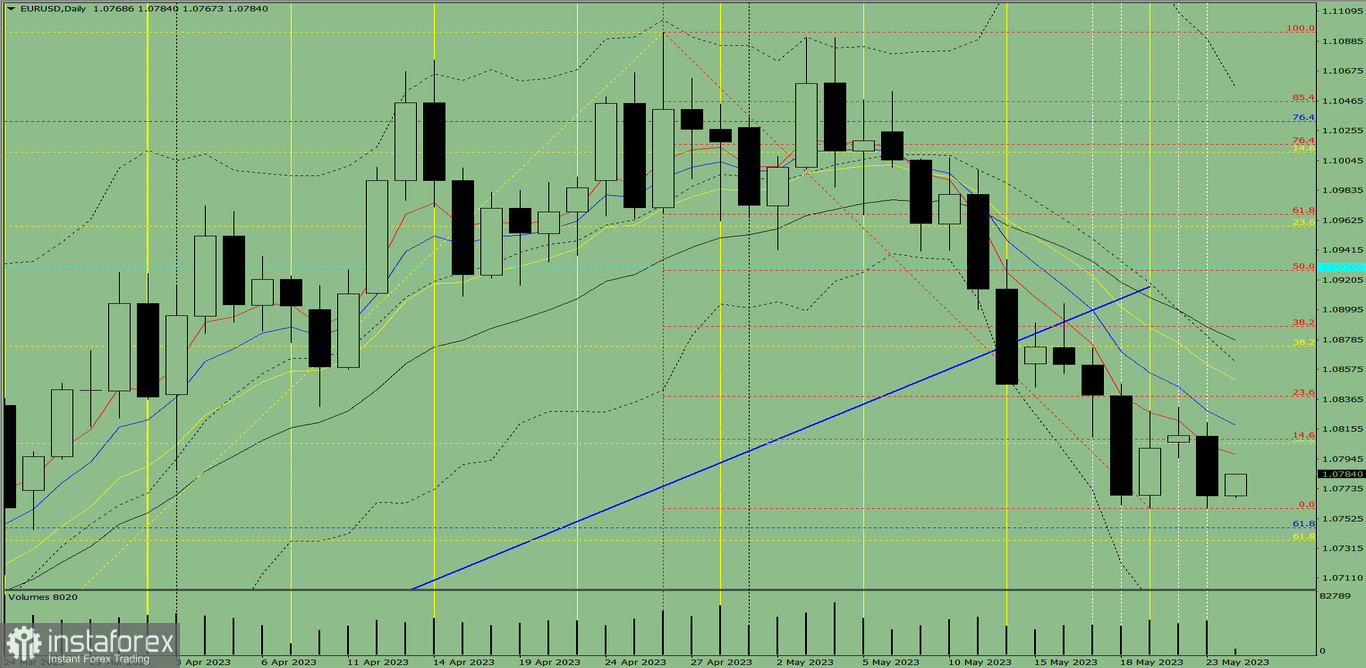
Fig. 1 (daily chart).
Comprehensive analysis:
- Indicator analysis - up;
- Fibonacci levels - up;
- Volumes - up;
- Candlestick analysis - up;
- Trend analysis - down;
- Bollinger bands - down;
- Weekly chart - down.
General conclusion:
Today, the price may move upward from the level of 1.0769 (closing of yesterday's daily candle) with the target of 1.0796, the 5-day EMA (thin red line). Upon reaching this level, a downward movement is possible with the target of 1.0737, the 61.8% pullback level (yellow dotted line).
Alternatively, the price may move upward from the level of 1.0769 (closing of yesterday's daily candle) with the target of 1.0818, the 8-day EMA (thin blue line). Upon reaching this level, a downward movement is possible with the target at 1.0760, the lower fractal (red dotted line).