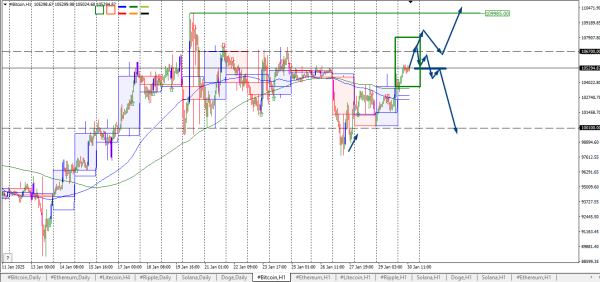
#Bitcoin. Н1. Hello colleagues. On the hourly chart, Bitcoin is trading in a range, with the lower boundary at the 100100 level, which corresponds to the opening of the bullish daily candle on January 17th. We can consider buying Bitcoin at the lower boundary of the range. If you entered a long position at the lower boundary of the range, the first take profit should be set at the upper boundary of the range around 106700, with the second target for a new high at 109985. For those not in the trade, selling can be considered at the 106700 level if there is a false breakout and a reversal pattern indicating a selling point. A daily candle closing above the 106700 level would suggest further upward movement for Bitcoin.
*Analisis pasaran yang dipaparkan di sini hanya bertujuan untuk meningkatkan kesedaran anda, tetapi bukan sebagai petunjuk untuk anda melakukan perdagangan
 Bahasa Malay
  Русский
 English
 Bahasa Indonesia
 ไทย
ไทย Español
 Deutsch
 Български
 Français
 Tiếng Việt
 中文
中文 বাংলা
বাংলা हिन्दी
 Čeština
 Українська
 Română