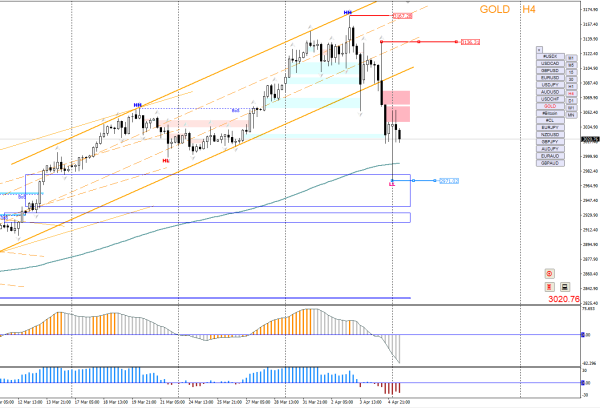
On the 4-hour chart of gold, I observe an interesting situation. In the morning, the price tested an important zone near the 200-day moving average but quickly returned to the closing level of last week - currently trading around 3021. I see that the AO and RSI indicators are showing selling pressure, confirming the current correction. Key levels to watch for: - Support at 2971 looks significant to the downside; - Resistance at 3136 is currently holding back further upside. Personally, I believe the correction is not yet over. The price has settled below the ascending channel, providing more bearish arguments. However, it must be acknowledged that as long as gold stays above 2971, the main trend remains bullish. I am closely monitoring the behavior around the 3000 mark. If we break below, a move towards 2971 is possible. But if we bounce back, there might be an attempt to re-enter the channel. In any case, after such a strong rally, the correction appears to be a healthy market reaction.
*L'analyse de marché présentée est de nature informative et n'est pas une incitation à effectuer une transaction
 Français
  Русский
 English
 Bahasa Indonesia
 Bahasa Malay
 ไทย
ไทย Español
 Deutsch
 Български
 Tiếng Việt
 中文
中文 বাংলা
বাংলা हिन्दी
 Čeština
 Українська
 Română