 Français
  Русский
 English
 Bahasa Indonesia
 Bahasa Malay
 ไทย
ไทย Español
 Deutsch
 Български
 Tiếng Việt
 中文
中文 বাংলা
বাংলা हिन्दी
 Čeština
 Українська
 Română
FX.co ★ Modèles réels. Analyse technique et recommandations de trading

Modèles d'analyse technique
There is nothing more precious to a trader than an ability to predict a further price movement. Technical analysis is a key to your successful transaction. At the same time, you can rely on common and recurring situations that arise in the same circumstances. Our Technical Analysis Patterns section features all trading recommendations based on the technical analysis patterns that help traders make projections and turn a profit.
Outil:
1 sélectionné
#Bitcoin
EURCHF
EURGBP
EURJPY
EURUSD
EURCAD
EURRUB
EURNZD
USDCAD
USDCHF
USDJPY
USDRUB
NZDCAD
NZDUSD
NZDCHF
NZDJPY
AUDCAD
AUDCHF
AUDJPY
AUDUSD
GBPUSD
GBPJPY
GBPAUD
GBPCHF
GOLD
SILVER
#AAPL
#AMZN
#EBAY
#FB
#GOOG
#MCD
#MA
#KO
#INTC
#MSFT
#NTDOY
#PEP
#TSLA
#TWTR
Figure:
All
Triangle
Rectangle
Pennant
Flag
Head and Shoulders
Double Top
Triple top
Timeframe:
All
M5
M15
M30
H1
D1
Signal strength:
All
High
Medium
Low
Signal direction:
All
Buy
Sell
#AMZN
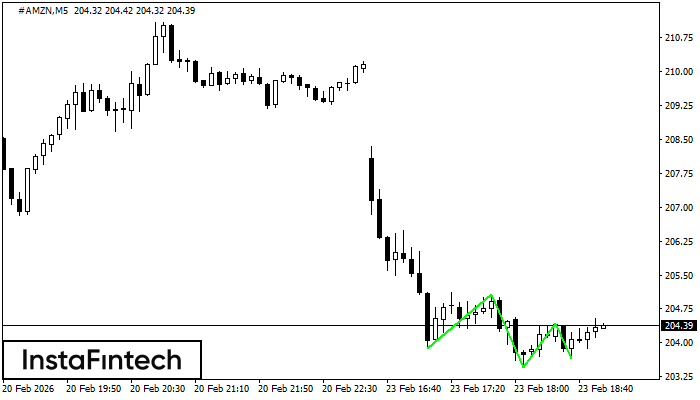
#AMZN M5
Triple Bottom
The Triple Bottom pattern has formed on the chart of the #AMZN M5 trading instrument. The pattern signals a change in the trend from downwards to upwards in the case of breakdown of 205.08/204.42.
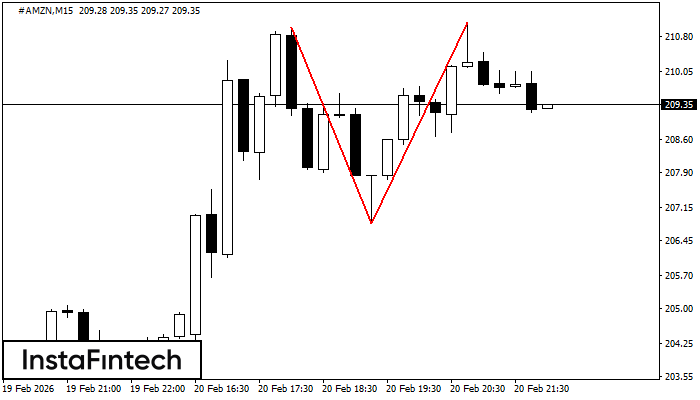
#AMZN M15
Double Top
The Double Top reversal pattern has been formed on #AMZN M15. Characteristics: the upper boundary 211.00; the lower boundary 206.81; the width of the pattern is 429 points. Sell trades are better to be opened below the lower boundary 206.81 with a possible movements towards the 206.59 level.
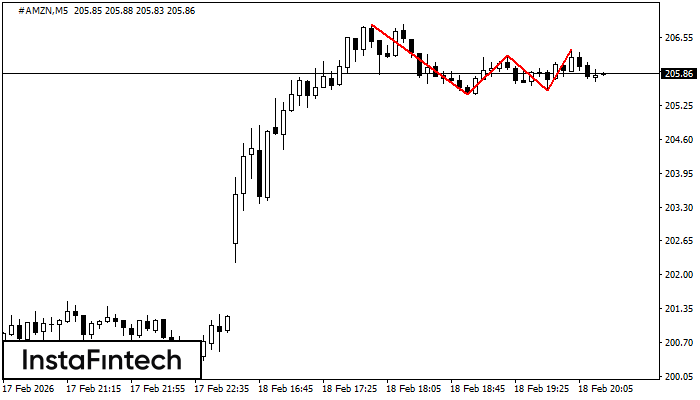
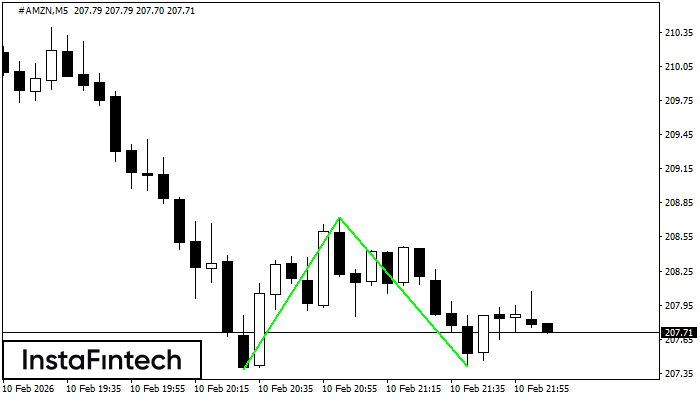
#AMZN M5
Triple Top
On the chart of the #AMZN M5 trading instrument, the Triple Top pattern that signals a trend change has formed. It is possible that after formation of the third peak, the price will try to break through the resistance level 205.46, where we advise to open a trading position for sale. Take profit is the projection of the pattern’s width, which is 134 points.
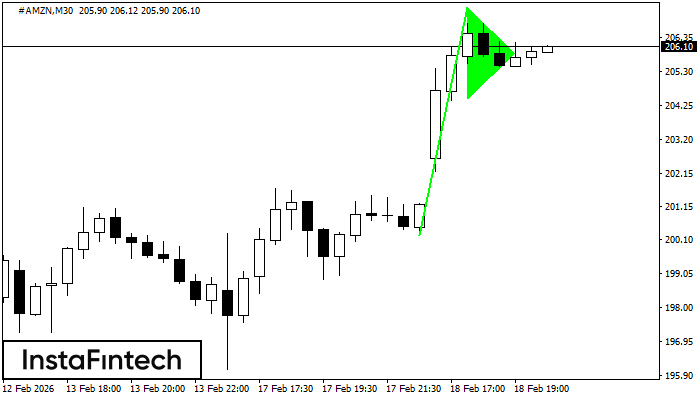
#AMZN M30
Bullish pennant
The Bullish pennant signal – Trading instrument #AMZN M30, continuation pattern. Forecast: it is possible to set up a buy position above the pattern’s high of 207.29, with the prospect of the next move being a projection of the flagpole height.
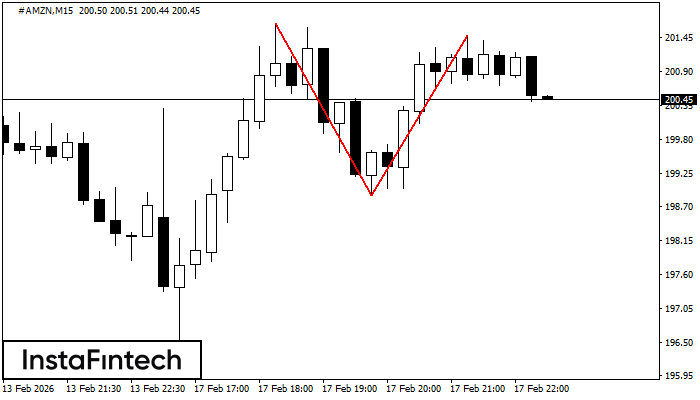
#AMZN M15
Double Top
On the chart of #AMZN M15 the Double Top reversal pattern has been formed. Characteristics: the upper boundary 201.48; the lower boundary 198.88; the width of the pattern 260 points. The signal: a break of the lower boundary will cause continuation of the downward trend targeting the 198.65 level.
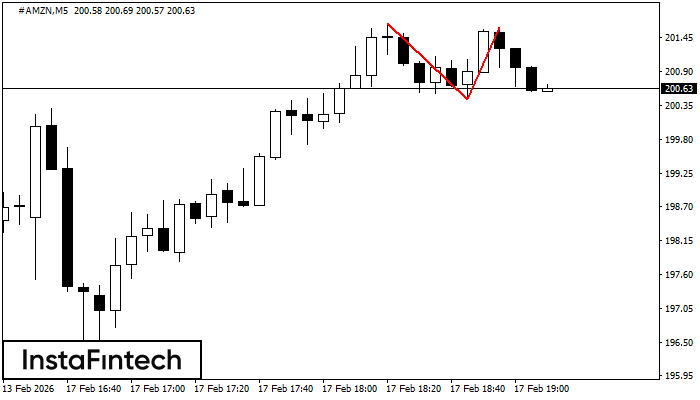
#AMZN M5
Double Top
The Double Top reversal pattern has been formed on #AMZN M5. Characteristics: the upper boundary 201.68; the lower boundary 200.44; the width of the pattern is 118 points. Sell trades are better to be opened below the lower boundary 200.44 with a possible movements towards the 200.29 level.
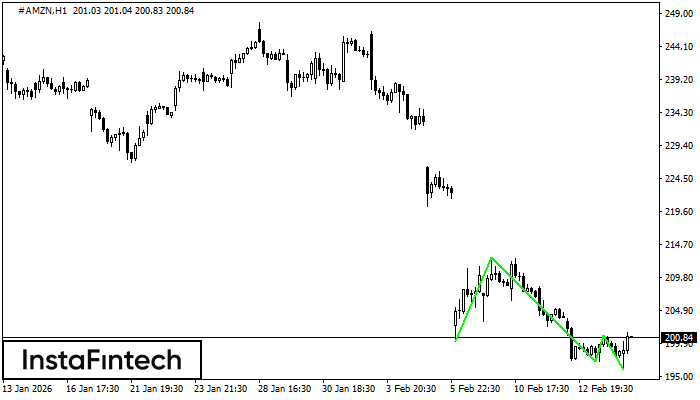
#AMZN H1
Triple Bottom
The Triple Bottom pattern has formed on the chart of the #AMZN H1 trading instrument. The pattern signals a change in the trend from downwards to upwards in the case of breakdown of 212.75/201.11.
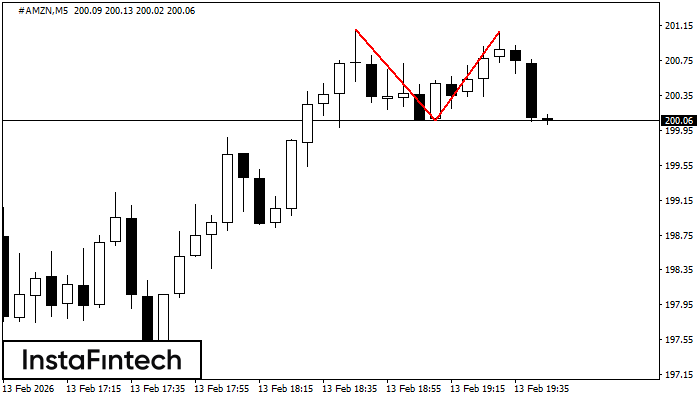
#AMZN M5
Double Top
On the chart of #AMZN M5 the Double Top reversal pattern has been formed. Characteristics: the upper boundary 201.08; the lower boundary 200.06; the width of the pattern 102 points. The signal: a break of the lower boundary will cause continuation of the downward trend targeting the 199.91 level.

#AMZN M30
Bearish pennant
The Bearish pennant pattern has formed on the #AMZN M30 chart. This pattern type is characterized by a slight slowdown after which the price will move in the direction of the original trend. In case the price fixes below the pattern’s low of 197.05, a trader will be able to successfully enter the sell position.
#AMZN M5
Double Bottom
The Double Bottom pattern has been formed on #AMZN M5; the upper boundary is 208.72; the lower boundary is 207.41. The width of the pattern is 134 points. In case of a break of the upper boundary 208.72, a change in the trend can be predicted where the width of the pattern will coincide with the distance to a possible take profit level.