 Français
  Русский
 English
 Bahasa Indonesia
 Bahasa Malay
 ไทย
ไทย Español
 Deutsch
 Български
 Tiếng Việt
 中文
中文 বাংলা
বাংলা हिन्दी
 Čeština
 Українська
 Română
FX.co ★ Modèles réels. Analyse technique et recommandations de trading

Modèles d'analyse technique
There is nothing more precious to a trader than an ability to predict a further price movement. Technical analysis is a key to your successful transaction. At the same time, you can rely on common and recurring situations that arise in the same circumstances. Our Technical Analysis Patterns section features all trading recommendations based on the technical analysis patterns that help traders make projections and turn a profit.
Outil:
1 sélectionné
#Bitcoin
EURCHF
EURGBP
EURJPY
EURUSD
EURCAD
EURRUB
EURNZD
USDCAD
USDCHF
USDJPY
USDRUB
NZDCAD
NZDUSD
NZDCHF
NZDJPY
AUDCAD
AUDCHF
AUDJPY
AUDUSD
GBPUSD
GBPJPY
GBPAUD
GBPCHF
GOLD
SILVER
#AAPL
#AMZN
#EBAY
#FB
#GOOG
#MCD
#MA
#KO
#INTC
#MSFT
#NTDOY
#PEP
#TSLA
#TWTR
Figure:
All
Triangle
Rectangle
Pennant
Flag
Head and Shoulders
Double Top
Triple top
Timeframe:
All
M5
M15
M30
H1
D1
Signal strength:
All
High
Medium
Low
Signal direction:
All
Buy
Sell
#Bitcoin
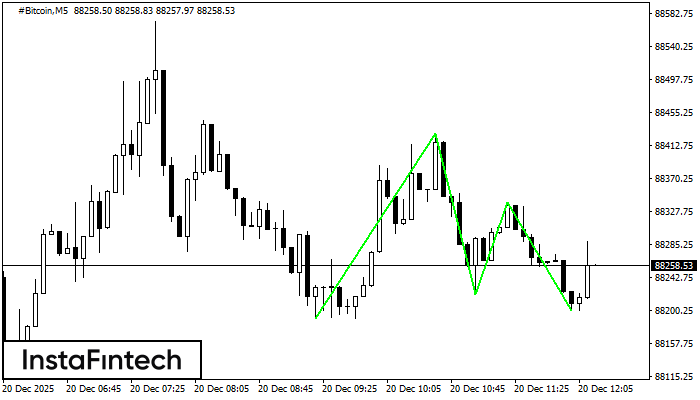
#Bitcoin M5
Triple Bottom
The Triple Bottom pattern has formed on the chart of the #Bitcoin M5 trading instrument. The pattern signals a change in the trend from downwards to upwards in the case of breakdown of 88428.61/88339.72.
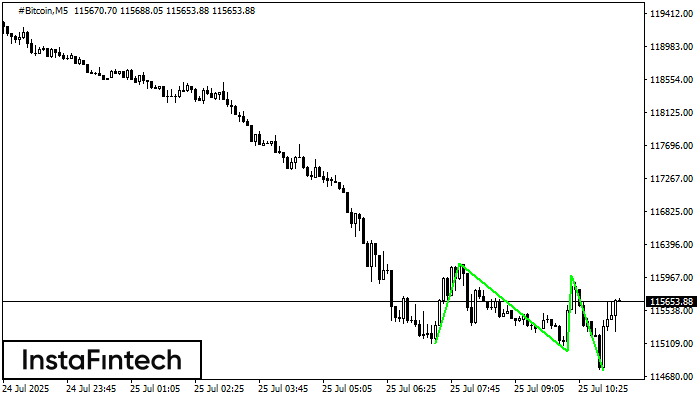
#Bitcoin M5
Triple Bottom
The Triple Bottom pattern has been formed on #Bitcoin M5. It has the following characteristics: resistance level 116154.33/115987.88; support level 115100.14/114755.07; the width is 105419 points. In the event of a breakdown of the resistance level of 116154.33, the price is likely to continue an upward movement at least to 114998.00.
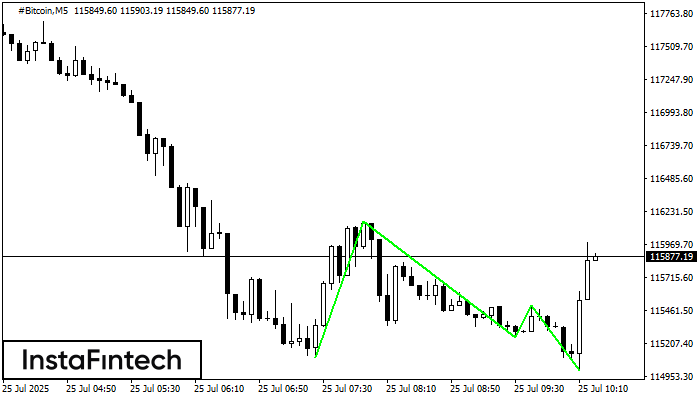
#Bitcoin M5
Triple Bottom
The Triple Bottom pattern has formed on the chart of #Bitcoin M5. Features of the pattern: The lower line of the pattern has coordinates 116154.33 with the upper limit 116154.33/115498.43, the projection of the width is 105419 points. The formation of the Triple Bottom pattern most likely indicates a change in the trend from downward to upward. This means that in the event of a breakdown of the resistance level 115100.14, the price is most likely to continue the upward movement.
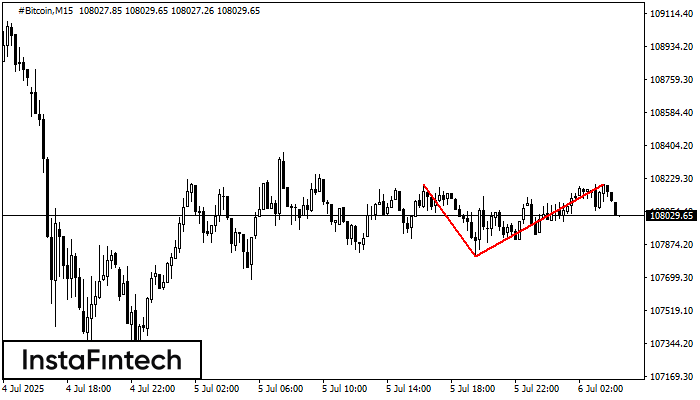
#Bitcoin M15
Double Top
On the chart of #Bitcoin M15 the Double Top reversal pattern has been formed. Characteristics: the upper boundary 108196.50; the lower boundary 107810.44; the width of the pattern 38606 points. The signal: a break of the lower boundary will cause continuation of the downward trend targeting the 107810.20 level.
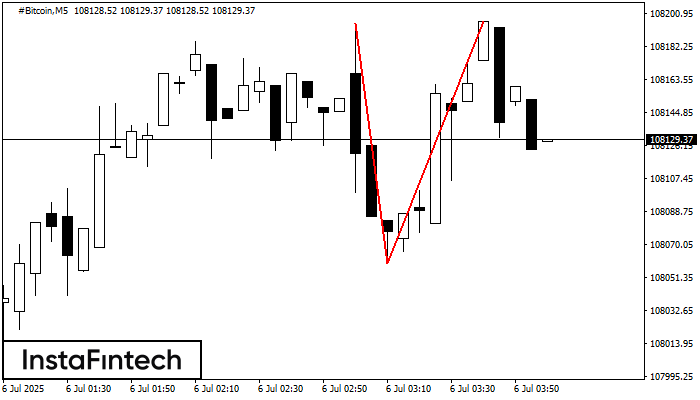
#Bitcoin M5
Double Top
The Double Top pattern has been formed on #Bitcoin M5. It signals that the trend has been changed from upwards to downwards. Probably, if the base of the pattern 108059.29 is broken, the downward movement will continue.

#Bitcoin M5
Bearish Symmetrical Triangle
According to the chart of M5, #Bitcoin formed the Bearish Symmetrical Triangle pattern. Trading recommendations: A breach of the lower border 107810.44 is likely to encourage a continuation of the downward trend.
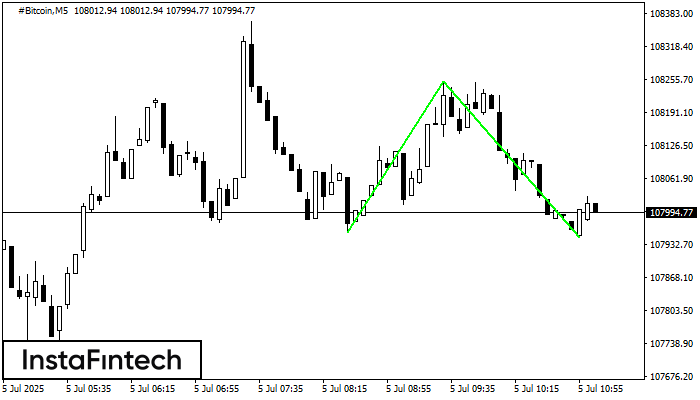
#Bitcoin M5
Bullish pennant
The Bullish pennant signal – Trading instrument #Bitcoin M5, continuation pattern. Forecast: it is possible to set up a buy position above the pattern’s high of 108182.82, with the prospect of the next move being a projection of the flagpole height.
#Bitcoin M5
Double Top
The Double Top pattern has been formed on #Bitcoin M5. It signals that the trend has been changed from upwards to downwards. Probably, if the base of the pattern 108036.85 is broken, the downward movement will continue.
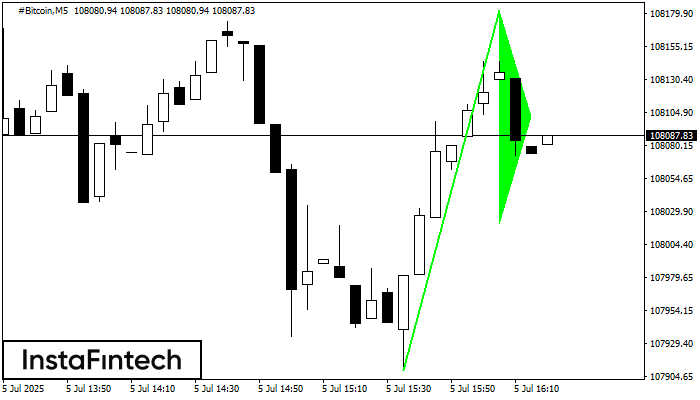
#Bitcoin M5
Double Bottom
The Double Bottom pattern has been formed on #Bitcoin M5. Characteristics: the support level 107955.72; the resistance level 108251.09; the width of the pattern 29537 points. If the resistance level is broken, a change in the trend can be predicted with the first target point lying at the distance of 30473 points.
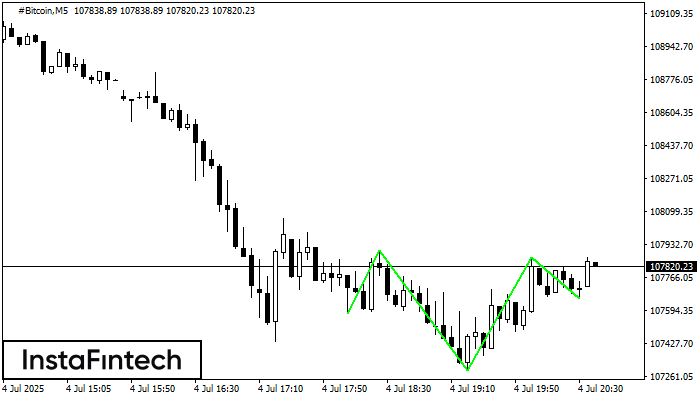
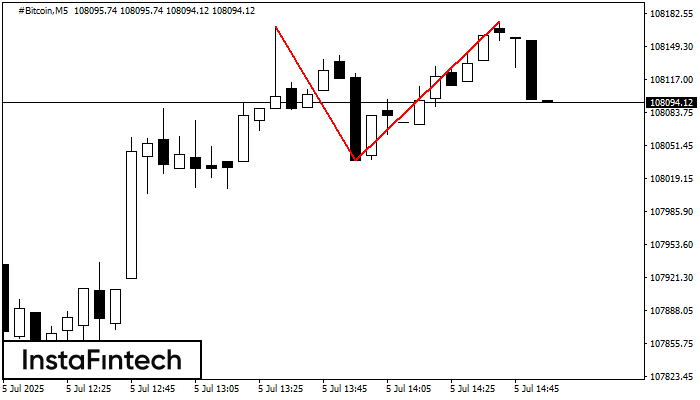
#Bitcoin M5
Inverse Head and Shoulder
According to the chart of M5, #Bitcoin produced the pattern termed the Inverse Head and Shoulder. The Head is fixed at 107290.48 while the median line of the Neck is set at 107901.08/107867.76. The formation of the Inverse Head and Shoulder Pattern clearly indicates a reversal of the downward trend. In means that in case the scenario comes true, the price of #Bitcoin will go towards 107867.90.