 English
  Русский
 Bahasa Indonesia
 Bahasa Malay
 ไทย
ไทย Español
 Deutsch
 Български
 Français
 Tiếng Việt
 中文
中文 বাংলা
বাংলা हिन्दी
 Čeština
 Українська
 Română
FX.co ★ Actual patterns. Technical analysis and trading recommendations

Technical Analysis Patterns
There is nothing more precious to a trader than an ability to predict a further price movement. Technical analysis is a key to your successful transaction. At the same time, you can rely on common and recurring situations that arise in the same circumstances. Our Technical Analysis Patterns section features all trading recommendations based on the technical analysis patterns that help traders make projections and turn a profit.
Instrument:
1 selected
#Bitcoin
EURCHF
EURGBP
EURJPY
EURUSD
EURCAD
EURRUB
EURNZD
USDCAD
USDCHF
USDJPY
USDRUB
NZDCAD
NZDUSD
NZDCHF
NZDJPY
AUDCAD
AUDCHF
AUDJPY
AUDUSD
GBPUSD
GBPJPY
GBPAUD
GBPCHF
GOLD
SILVER
#AAPL
#AMZN
#EBAY
#FB
#GOOG
#MCD
#MA
#KO
#INTC
#MSFT
#NTDOY
#PEP
#TSLA
#TWTR
Figure:
All
Triangle
Rectangle
Pennant
Flag
Head and Shoulders
Double Top
Triple top
Timeframe:
All
M5
M15
M30
H1
D1
Signal strength:
All
High
Medium
Low
Signal direction:
All
Buy
Sell
#MCD
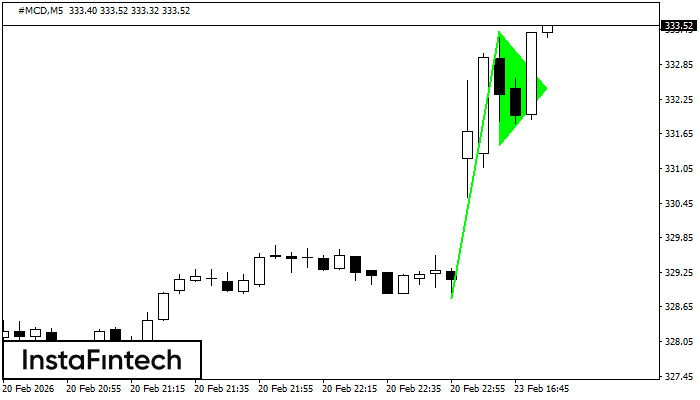
#MCD M5
Bullish pennant
The Bullish pennant graphic pattern has formed on the #MCD M5 instrument. This pattern type falls under the category of continuation patterns. In this case, if the quote can breaks out high, is expected to continue the upward trend to level 333.58.
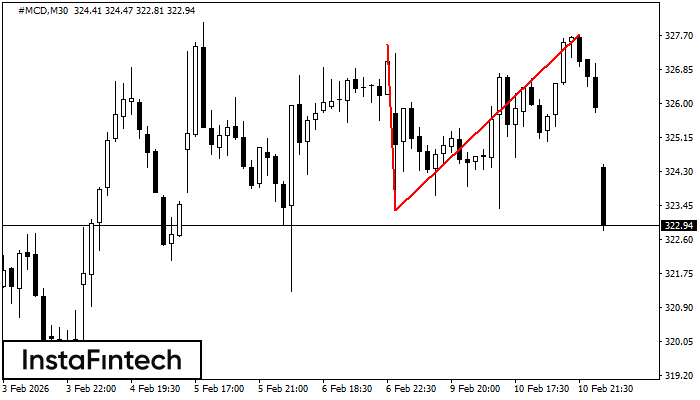
#MCD M30
Double Top
On the chart of #MCD M30 the Double Top reversal pattern has been formed. Characteristics: the upper boundary 327.74; the lower boundary 323.32; the width of the pattern 442 points. The signal: a break of the lower boundary will cause continuation of the downward trend targeting the 323.02 level.
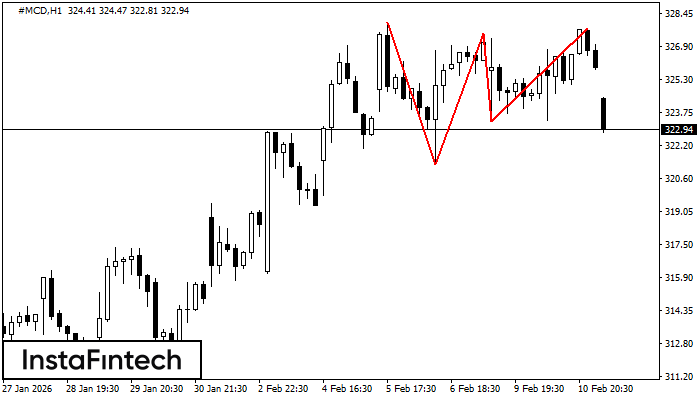
#MCD H1
Triple Top
The Triple Top pattern has formed on the chart of the #MCD H1 trading instrument. It is a reversal pattern featuring the following characteristics: resistance level 29, support level -202, and pattern’s width 673. Forecast If the price breaks through the support level 321.30, it is likely to move further down to 327.09.
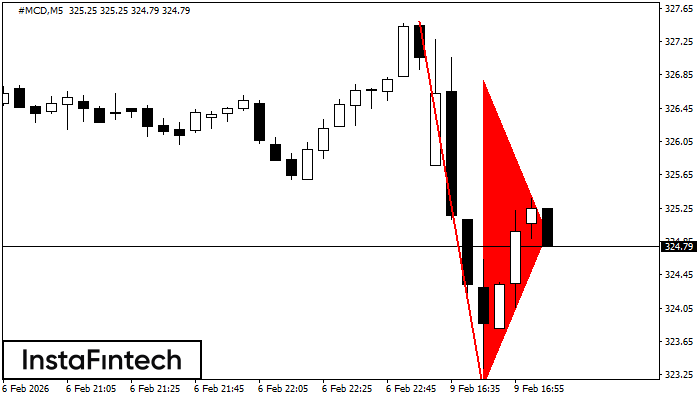
#MCD M5
Bearish pennant
The Bearish pennant pattern has formed on the #MCD M5 chart. The pattern signals continuation of the downtrend in case the pennant’s low of 323.11 is broken through. Recommendations: Place the sell stop pending order 10 pips below the pattern’s low. Place the take profit order at the projection distance of the flagpole height.
#MCD M5
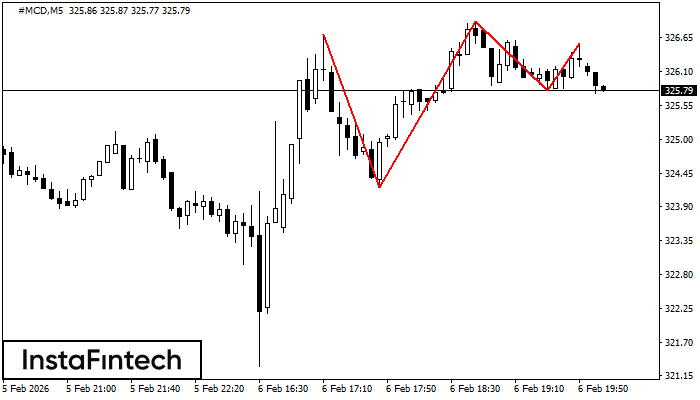
Triple Top
The Triple Top pattern has formed on the chart of the #MCD M5 trading instrument. It is a reversal pattern featuring the following characteristics: resistance level 15, support level -158, and pattern’s width 248. Forecast If the price breaks through the support level 324.22, it is likely to move further down to 326.76.
#MCD M15
Double Top
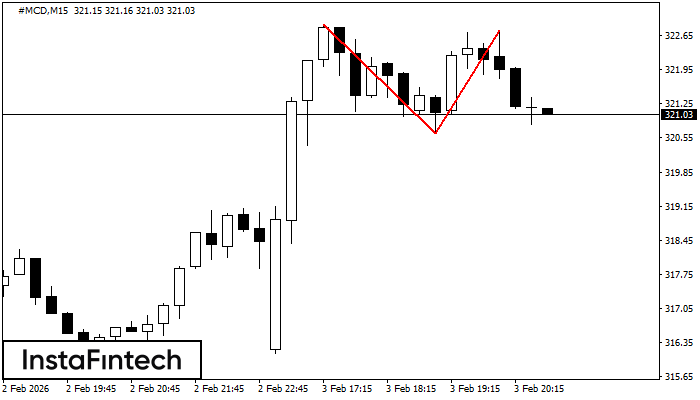
The Double Top reversal pattern has been formed on #MCD M15. Characteristics: the upper boundary 322.87; the lower boundary 320.65; the width of the pattern is 210 points. Sell trades are better to be opened below the lower boundary 320.65 with a possible movements towards the 320.42 level.
#MCD M5
Double Top
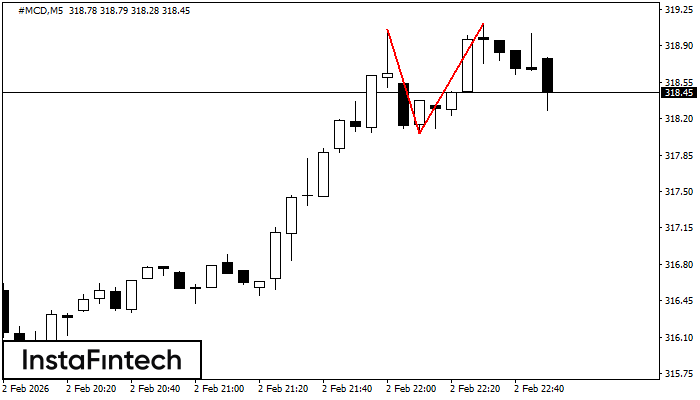
The Double Top reversal pattern has been formed on #MCD M5. Characteristics: the upper boundary 319.06; the lower boundary 318.06; the width of the pattern is 105 points. Sell trades are better to be opened below the lower boundary 318.06 with a possible movements towards the 317.91 level.
#MCD M5
Double Top
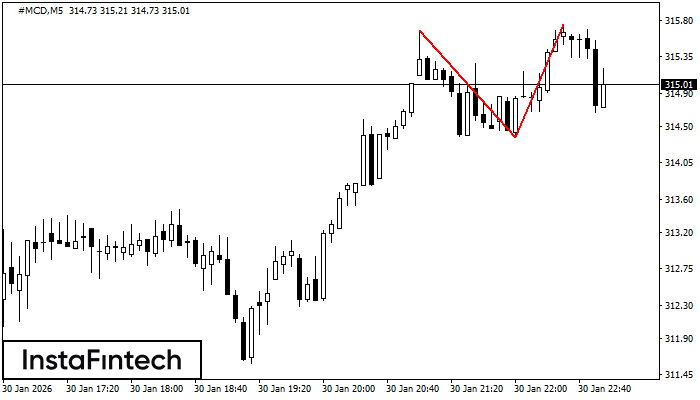
The Double Top pattern has been formed on #MCD M5. It signals that the trend has been changed from upwards to downwards. Probably, if the base of the pattern 314.36 is broken, the downward movement will continue.
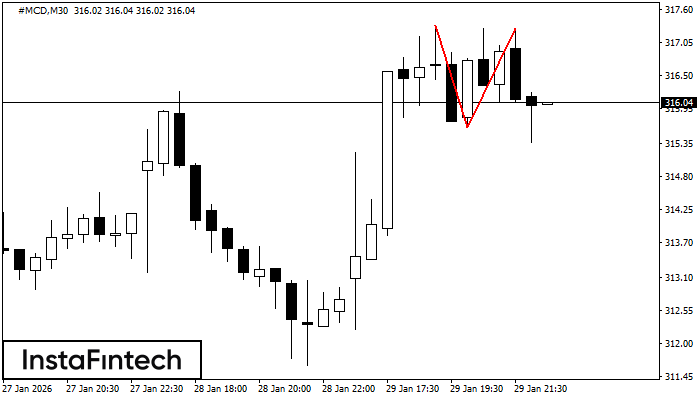
#MCD M30
Double Top
The Double Top reversal pattern has been formed on #MCD M30. Characteristics: the upper boundary 317.34; the lower boundary 315.63; the width of the pattern is 166 points. Sell trades are better to be opened below the lower boundary 315.63 with a possible movements towards the 315.33 level.
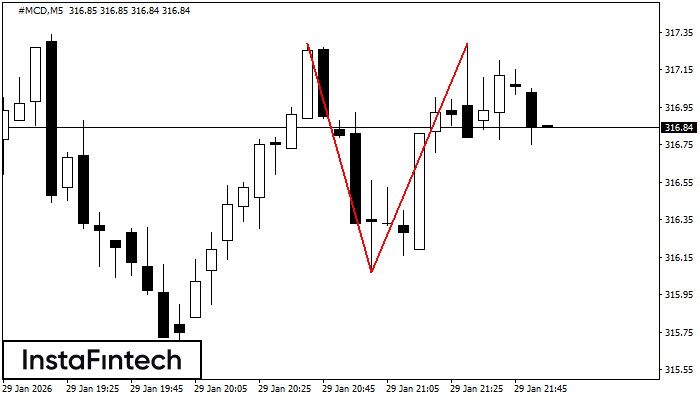
#MCD M5
Double Top
The Double Top pattern has been formed on #MCD M5. It signals that the trend has been changed from upwards to downwards. Probably, if the base of the pattern 316.07 is broken, the downward movement will continue.