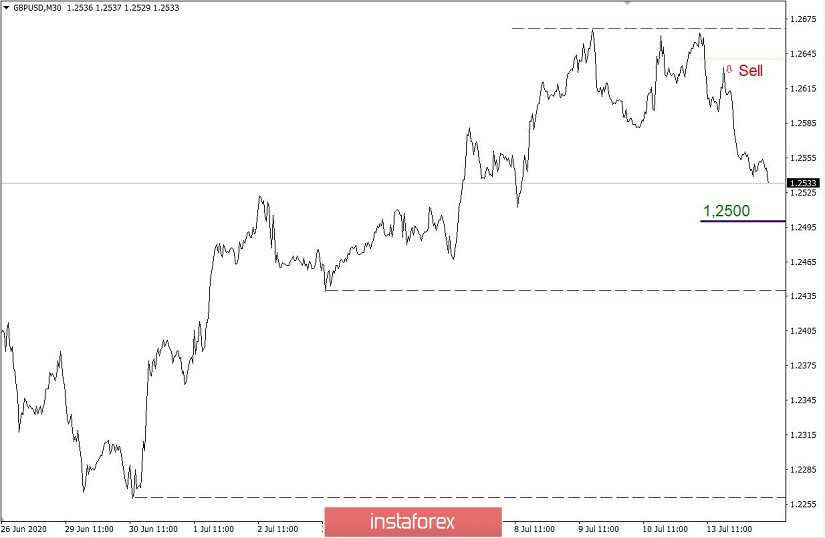
The periodic resistance in the area of 1.2660/1.2670 managed to restrain insatiable buyers, eventually reducing long positions and forming something similar to the "Double Peak" graphic pattern that accumulated sellers on the market. It is worth considering that the resistance of 1.2660/1.2670 is a kind of reflection from the local maximum on June 16 - 1.2686, which was the first attempt by buyers to break the downward tact.
By detailing the past trading day, it can be seen that the market was on the wave of speculation, where a round of short positions was found during the European session (7:00–8:00), as well as in the second half of the American session (17:00–19:00), which led to a local inertial move and the decline of the price to the area of 1.2550.
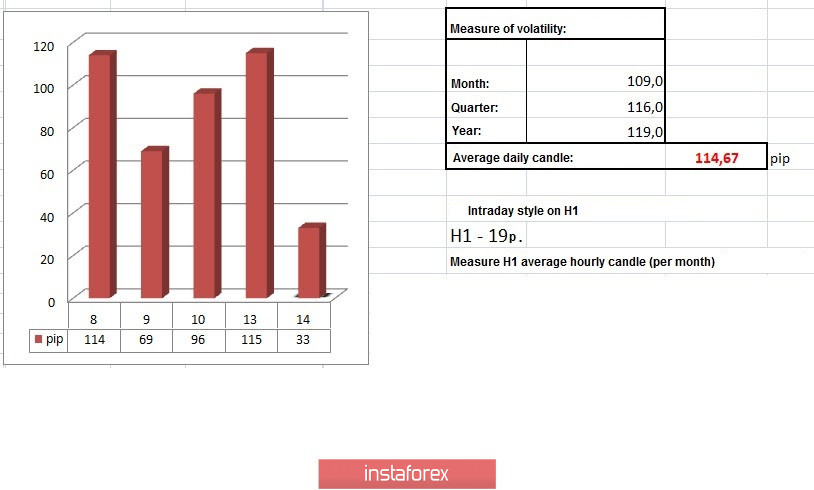
Market dynamics reflected an increase in activity by 115 points, which exceeds the volume of volatility of the past days.
The news background of the past day did not have the attention of statistics on the UK and the United States, but this did not stop speculators, the dynamics remained high.
In terms of informational background, there is an online statement by the head of the Bank of England, Andrew Bailey, during which he expressed concern about the increase in the number of unemployed in the United Kingdom, which could delay the process of economic recovery.
In turn, according to the British Retail Consortium, total retail sales grew in the first half of June, but this is largely due to online shopping. Street shops still suffer losses, which forces them to close, as consumers are not ready to visit them at the same frequency as before the coronavirus pandemic.
Today, in terms of the economic calendar, we have an impressive package of statistics for the UK, which did not support the pound. Monthly GDP figures for May reflected an increase of 1.8%, but forecast a recovery of 5.0%. Industrial production grew by 6.0% in May, but has declined to -20.0% year-on-year, which is in line with expectations. The volume of construction in May amounted to 8.2% with a forecast of 14.5%. There is a gap of -39.7% on an annualized basis.
The reaction of the market to a package of statistical data was in the form of a gradually dying pound sterling.
In the afternoon, the final data on inflation in the United States will be published, which is considered one of the main events of the week. Inflation is expected to rise from 0.1% to 0.5-0.6%. However, based on recent indicators of US producer prices, which were by no means the best, inflation forecasts may revise, which will greatly affect the rate of the US currency in terms of its weakening.
12:30 Universal time - US inflation

From the point of view of a comprehensive analysis, we see that the downward inertial course set a day earlier still takes place in the market, where the quote, after a slight slowdown, continued to update the lows. Traders are inclined to believe that inertial movement may well prolong short positions to the level of 1.2500, relative to which the subsequent price move will understand. In this case, the "Double Peak" graphic pattern will be generated almost 100%.
The burning forecast is that we take two strategies at once, the first reflects the technical part, which has an inertial movement directed towards 1.2500, where, depending on the price fixing points and the behavior of market participants within the level, the subsequent course of the quote will be clear. The second side of the forecast comes from fundamental analysis, in particular, data on US inflation. So, if the inflation data reflect the projected growth, then the chance of strengthening the US dollar towards the level of 1.2450-1.2350 will be great. If inflation comes out worse than the forecast, we will see an almost immediate reaction in terms of weakening the dollar. Here, the technical part may be interesting, since before the publication of statistical data, the quote will go down to the level of 1.2500 just on inertia, but closer to the American trading session, there will be a game on the news.
Indicator analysis

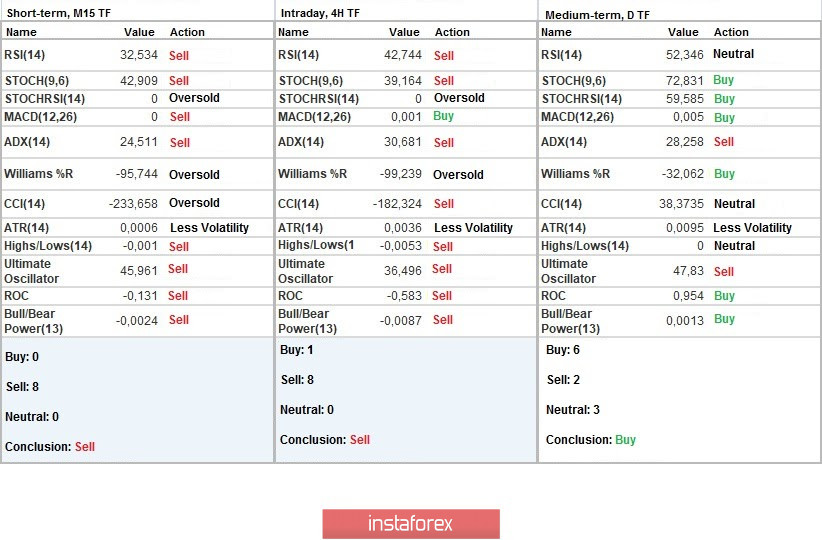
Analyzing a different sector of time frames (TF), we see that the indicators of technical tools relative to minute and hour intervals signal a sale due to a rapid inertial course and consolidating the price at around 1.2550. The daily period still signals a purchase, but if the price consolidates below the level of 1.2500, everything can change.

Volatility per week / Measurement of volatility: Month; Quarter; Year
Volatility measurement reflects the daily average fluctuation, calculated for the Month / Quarter / Year.
(July 14 was built taking into account the time of publication of the article)
The volatility of the current time is 33 points, which is 71% lower than the daily average. It can be assumed that amid inertia and inflation speculation, volatility will continue to grow.

Key levels
Resistance Zones: 1.2770 **; 1.2885 *; 1.3000; 1.3170 **; 1.3300 **; 1.3600; 1.3850; 1.4000 ***; 1.4350 **.
Support Zones: 1.2620; 1.2500; 1.2350 **; 1.2250; 1.2150 **; 1.2000 *** (1.1957); 1.1850; 1.1660; 1.1450 (1.1411); 1.1300; 1.1000; 1.0800; 1.0500; 1.0000.
* Periodic level
** Range Level
*** Psychological level
 English
 Русский
 Bahasa Indonesia
 Bahasa Malay
 ไทย
ไทย Español
 Deutsch
 Български
 Français
 Tiếng Việt
 中文
中文 বাংলা
বাংলা हिन्दी
 Čeština
 Українська
 Română

