 English
  Русский
 Bahasa Indonesia
 Bahasa Malay
 ไทย
ไทย Español
 Deutsch
 Български
 Français
 Tiếng Việt
 中文
中文 বাংলা
বাংলা हिन्दी
 Čeština
 Українська
 Română

The Dollar index has broken below horizontal support at 95.50. Price is now trying back test the break out area. If the break down was real, we should see a rejection and a move lower.
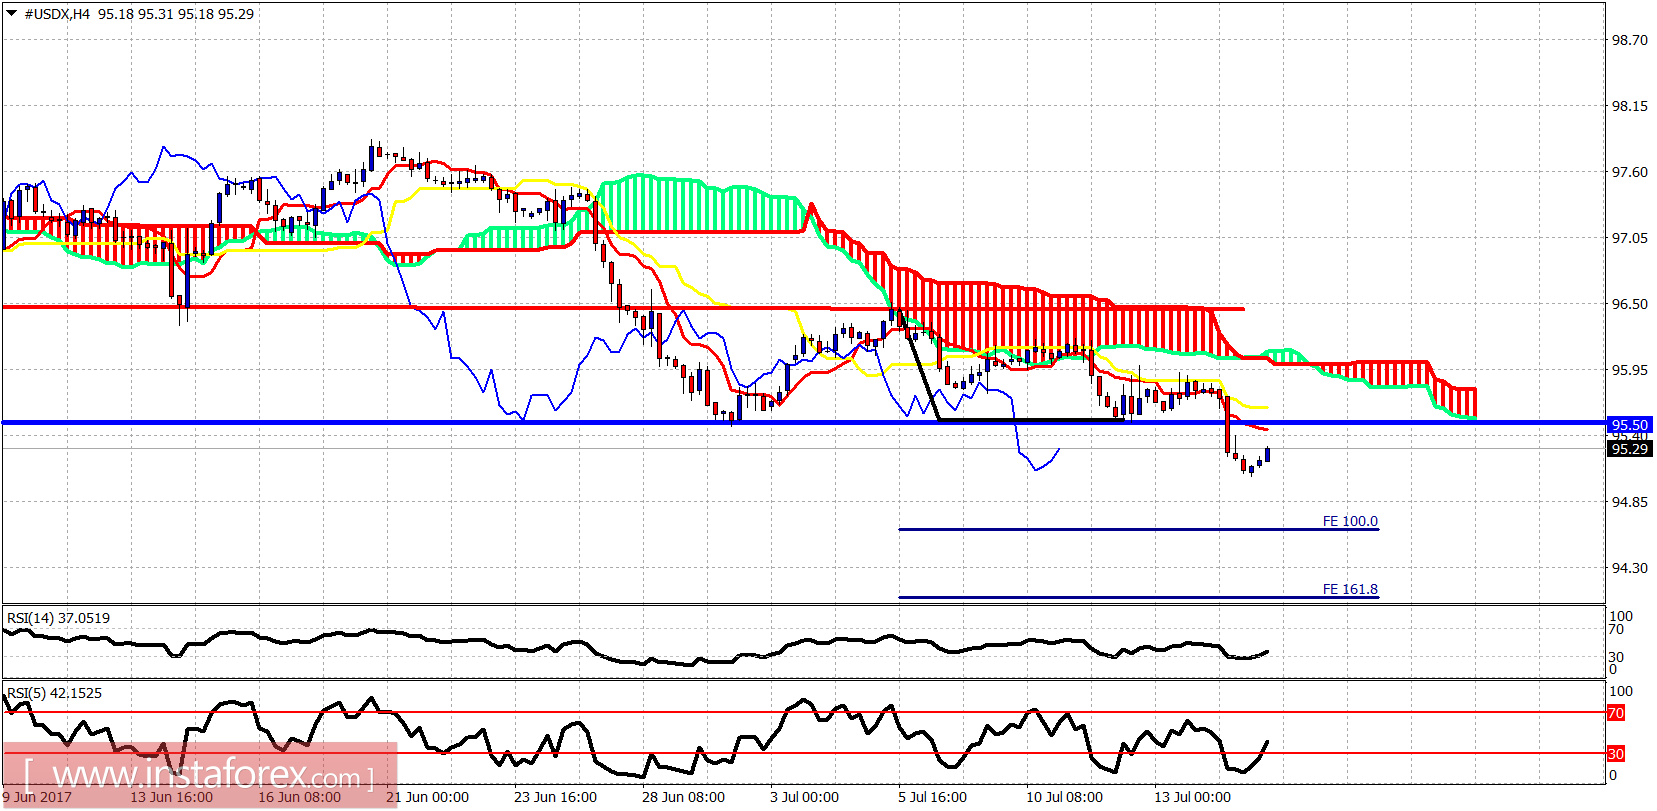
Red lines -resistance
Blue lines - support (broken)
The Dollar index has bearish target of 94.70. If however we see price break above 95.50 and 95.90 we should consider the breakdown as a false one. This would be a very bullish sign.
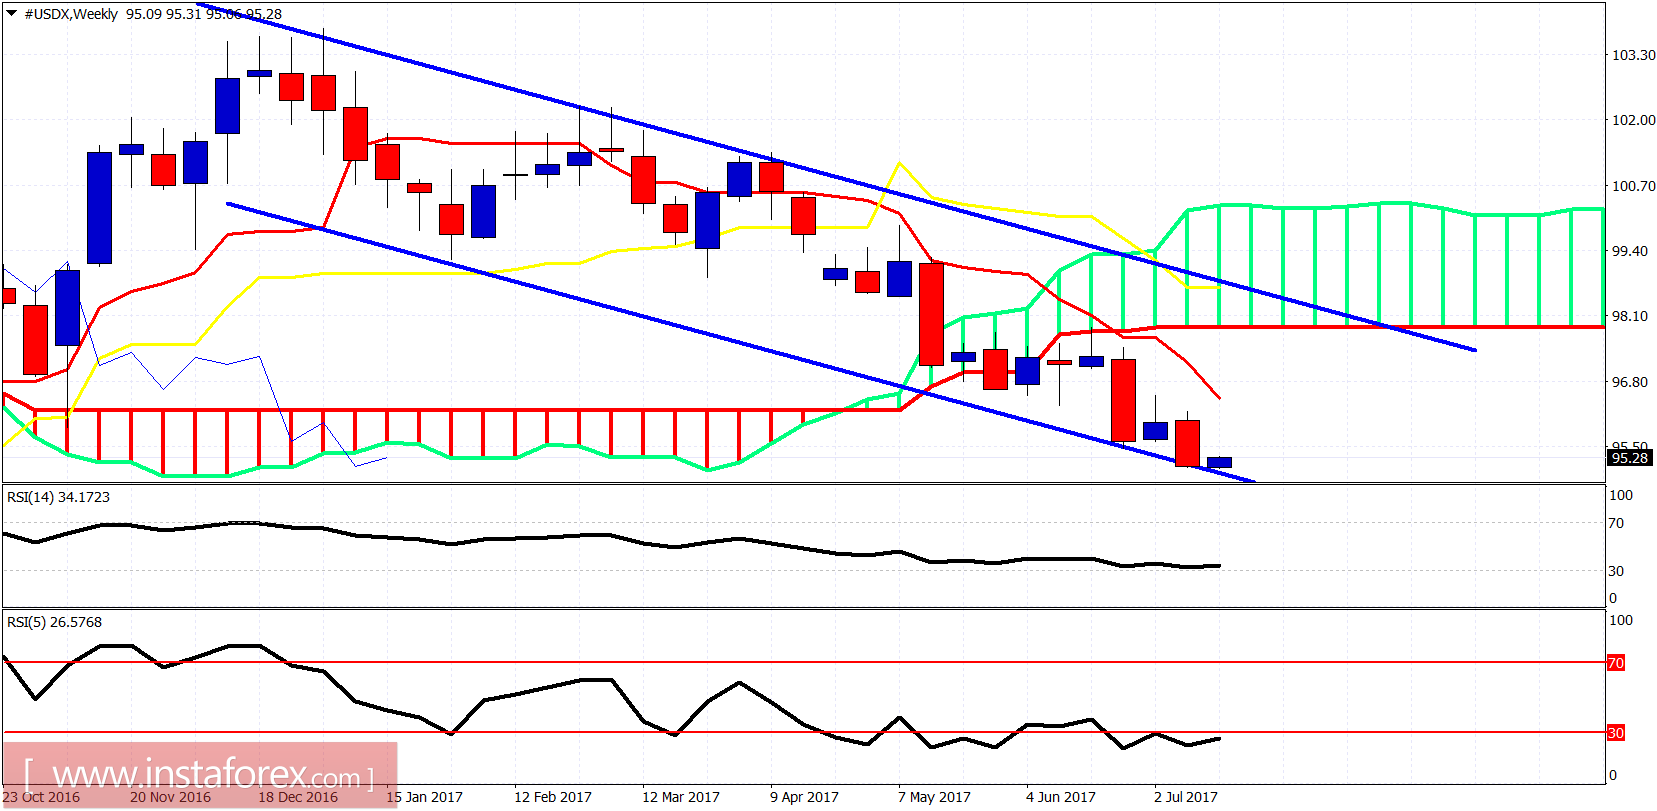
On a weekly basis the RSI continues to diverge and provide warning signs. Price makes lower lows but is trading on top of the lower channel boundary. I continue to expect a bounce towards the weekly Kumo (cloud) and upper channel boundary before committing to a short position.