 English
  Русский
 Bahasa Indonesia
 Bahasa Malay
 ไทย
ไทย Español
 Deutsch
 Български
 Français
 Tiếng Việt
 中文
中文 বাংলা
বাংলা हिन्दी
 Čeština
 Українська
 Română

The Gold price as we expected has broken out of the bearish short-term channel. The trend has reversed to bullish and my minimum expected target is at $1,260 this week. There we could see a pull back but overall I believe a larger degree move higher has started.
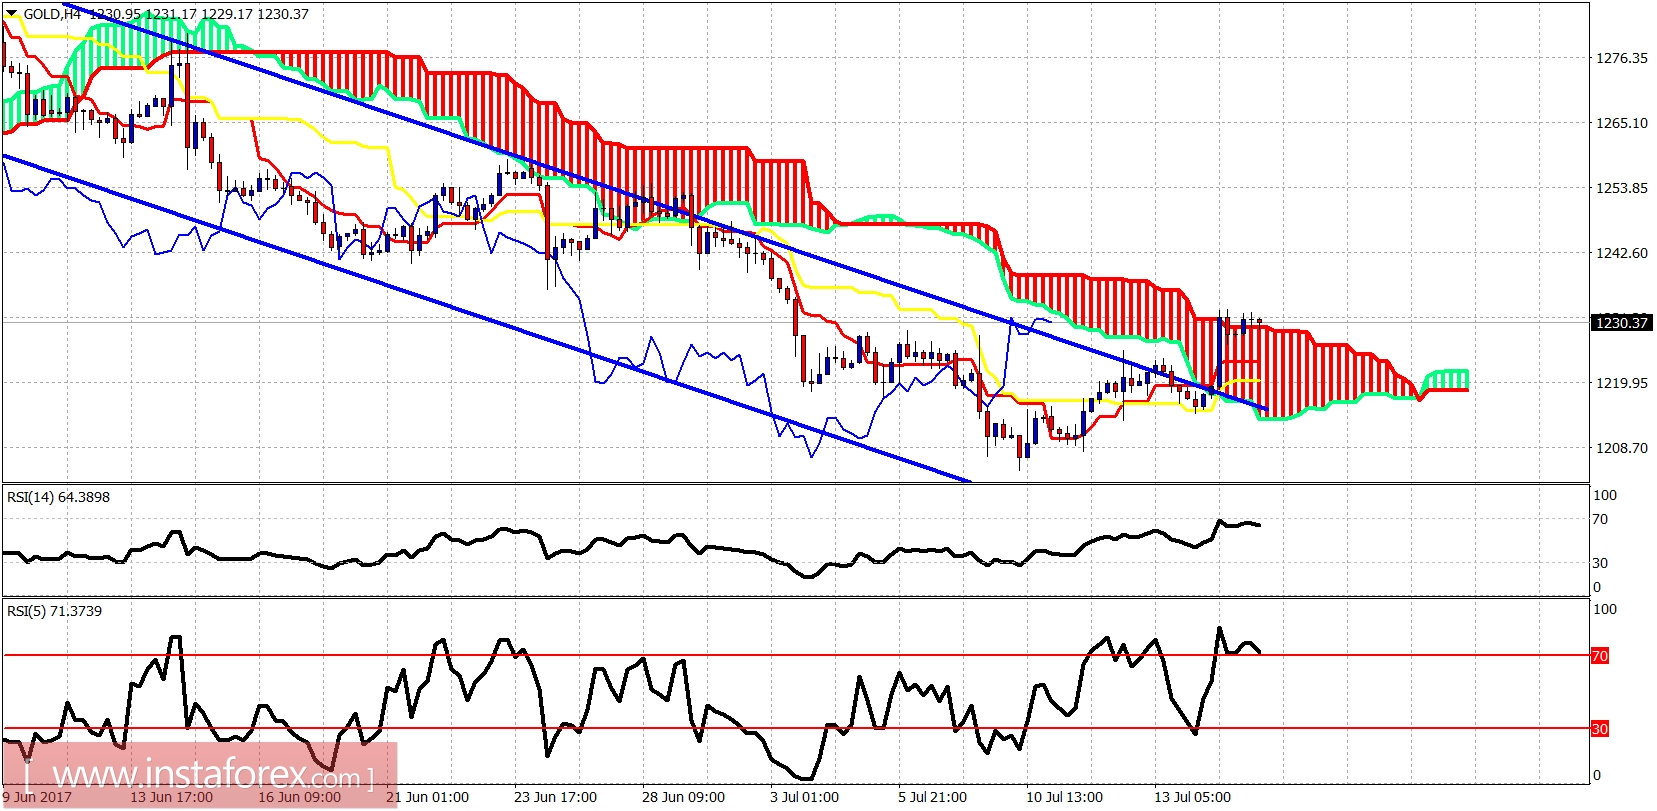
The Gold price has broken out of the bearish channel and is trading above the Ichimoku cloud. The trend is bullish. Short-term support is at $1,215. Resistance is at $1,260. I expect Gold to reach $1,250-60 these weeks.
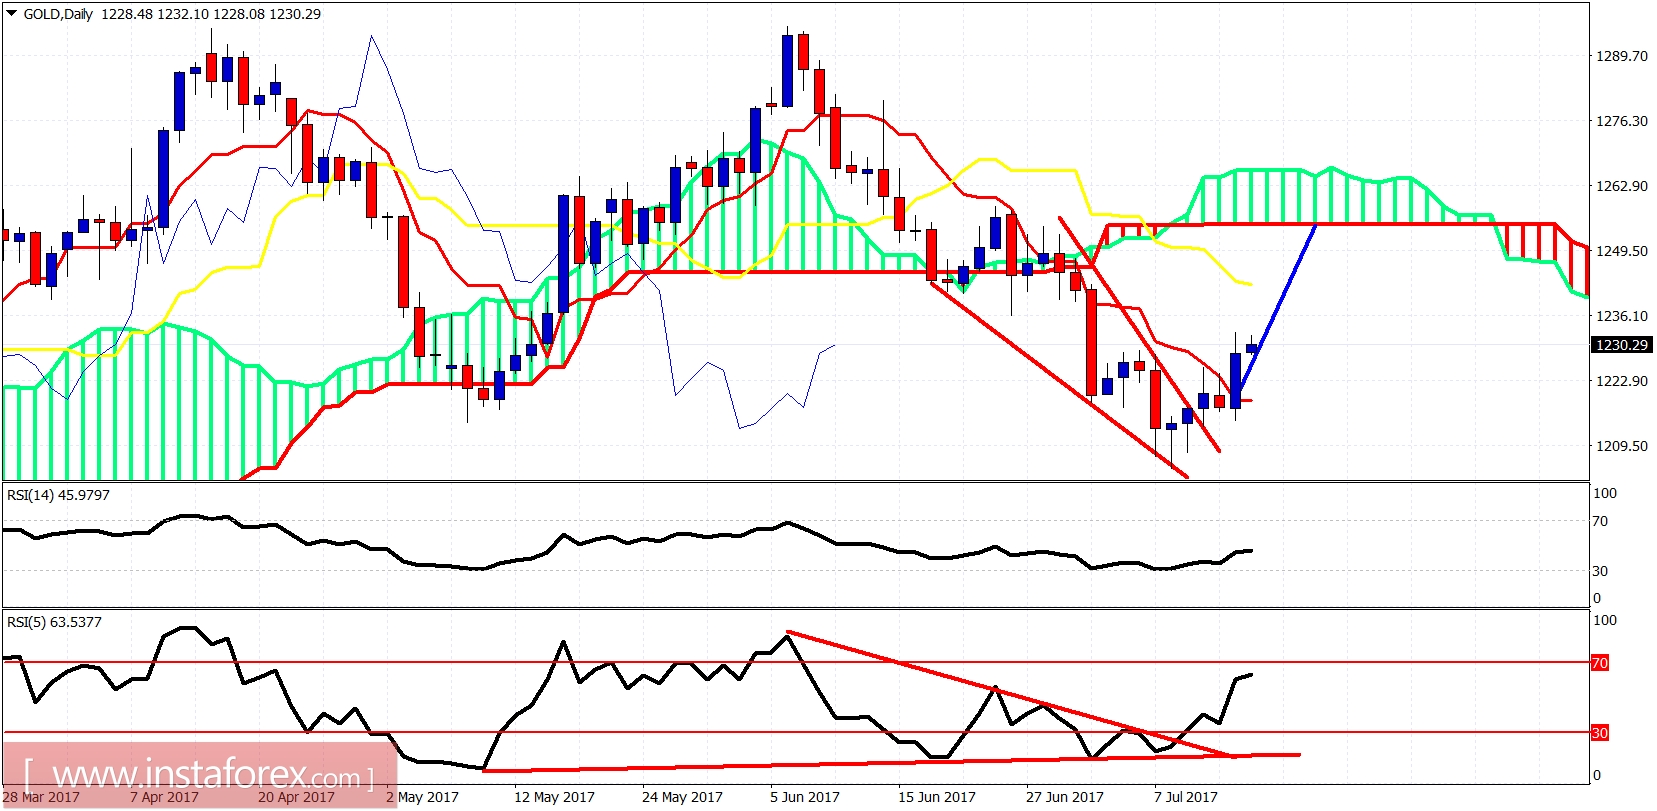
The Gold price has broken the wedge pattern upwards and the minimum target is the daily Kumo (cloud) level at $1,250-60. Breaking the wedge was timely notified by our analysis combined with the warning signs of the oversold conditions of the RSI (5).