 English
  Русский
 Bahasa Indonesia
 Bahasa Malay
 ไทย
ไทย Español
 Deutsch
 Български
 Français
 Tiếng Việt
 中文
中文 বাংলা
বাংলা हिन्दी
 Čeština
 Українська
 Română

USDX remains offered and it looks like the downside breakout should come in the next days. The support zone of 95.10 is helping to cap further bearish advance and if we witness a break below there, then another selling wave could impact the greenback to test the 94.16 level. MACD indicator is entering the oversold territory, calling for some rebounds.
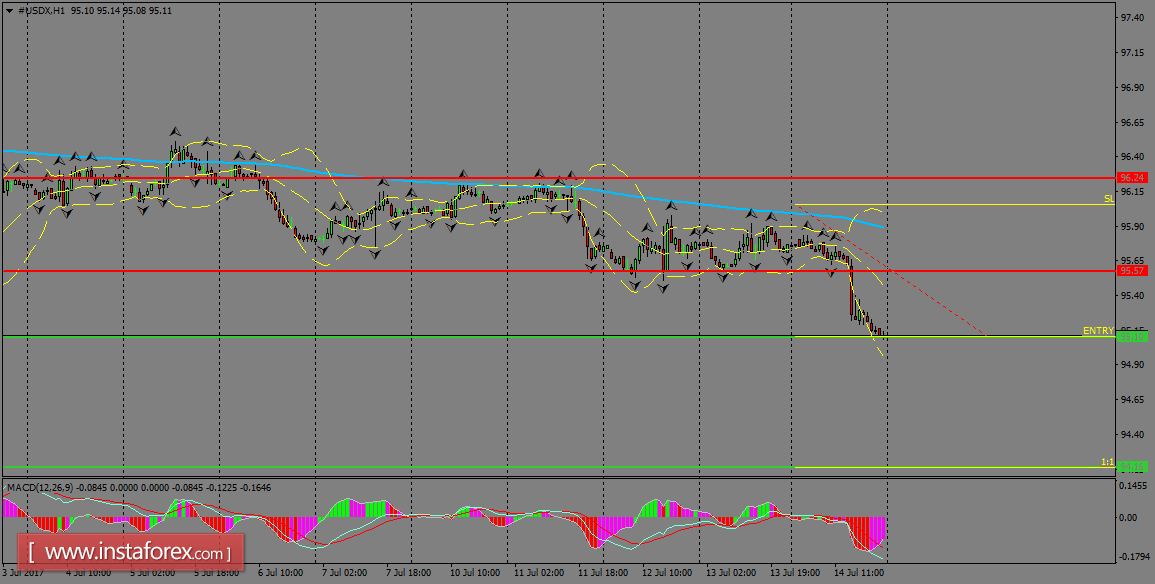
H1 chart's resistance levels: 95.57 / 96.24
H1 chart's support levels: 95.10 / 94.16
Trading recommendations for today: Based on the H1 chart, place sell (short) orders only if the USD Index breaks with a bearish candlestick; the support level is at 95.10, take profit is at 94.16 and stop loss is at 96.05.