 English
  Русский
 Bahasa Indonesia
 Bahasa Malay
 ไทย
ไทย Español
 Deutsch
 Български
 Français
 Tiếng Việt
 中文
中文 বাংলা
বাংলা हिन्दी
 Čeština
 Українська
 Română

GBP/USD had a strong momentum during Friday's session, as the greenback weakened across the markets and sent the pair to test the resistance zone of 1.3106. Such move opens the doors to reach the 1.3238 level as the next target to the upside. MACD indicator remains in the positive territory and the 200 SMA still points to the north.
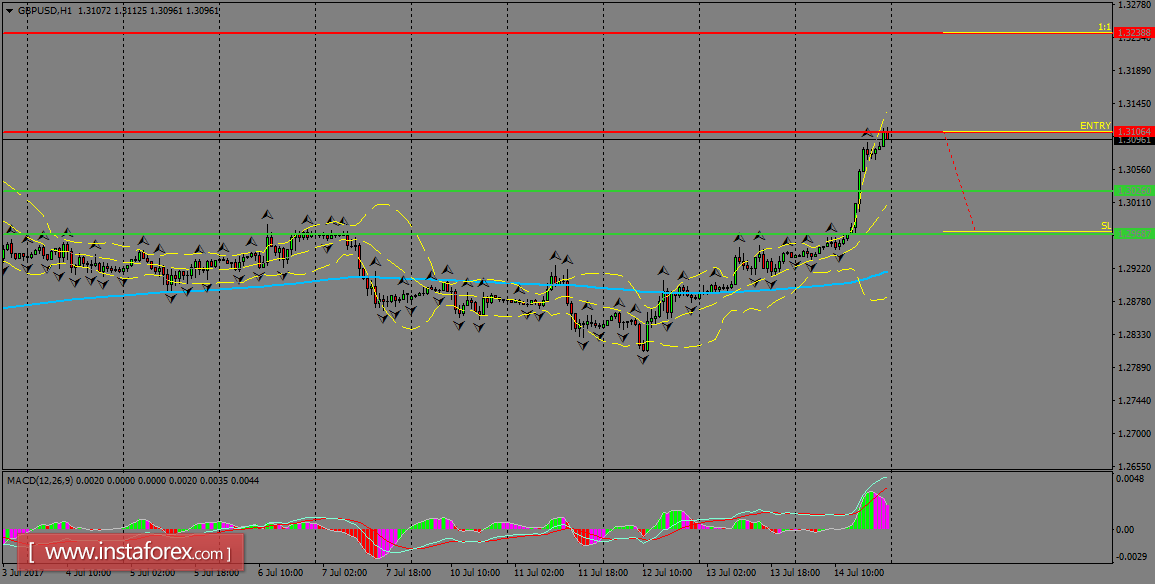
H1 chart's resistance levels: 1.3106 / 1.3238
H1 chart's support levels: 1.3026 / 1.2968
Trading recommendations for today: Based on the H1 chart, buy (long) orders only if the GBP/USD pair breaks a bullish candlestick; the resistance level is at 1.3106, take profit is at 1.3238 and stop loss is at 1.2971.