 English
  Русский
 Bahasa Indonesia
 Bahasa Malay
 ไทย
ไทย Español
 Deutsch
 Български
 Français
 Tiếng Việt
 中文
中文 বাংলা
বাংলা हिन्दी
 Čeština
 Українська
 Română

The Dollar index remains above the recent lows at 95.50 although the chances of breaking the lows are high. The trend remains bearish. Breaking below 95.50 will open the way for a move towards 94.70.
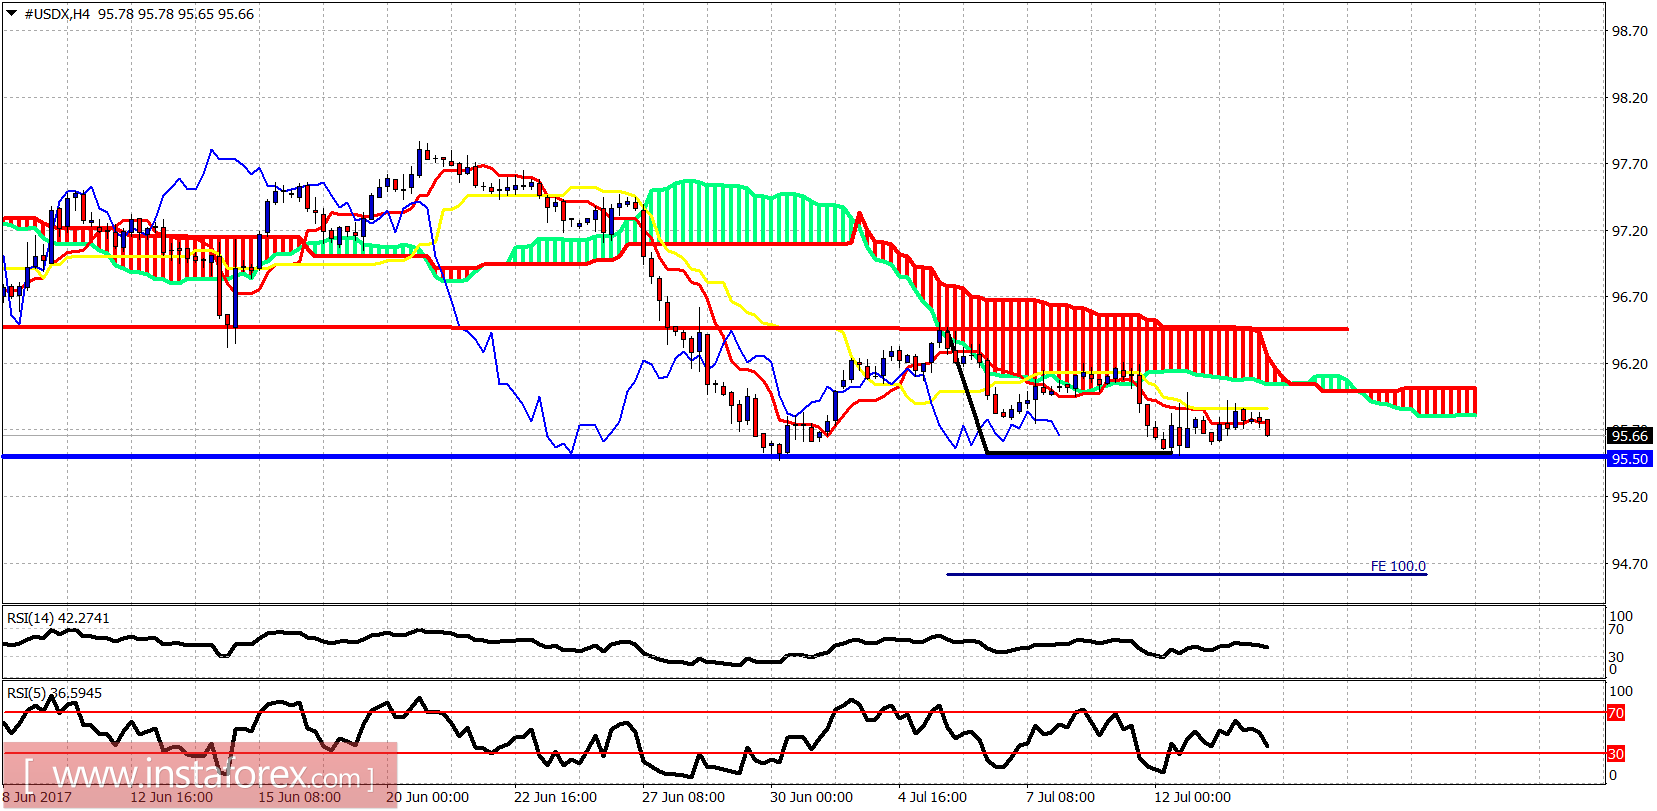
Blue line- support
The Dollar index is trading below the Kumo in the 4-hour chart and looks ready to break below 95.50. There are some bullish divergence signs by both the RSI and this is a warning for traders not to get too bearish.
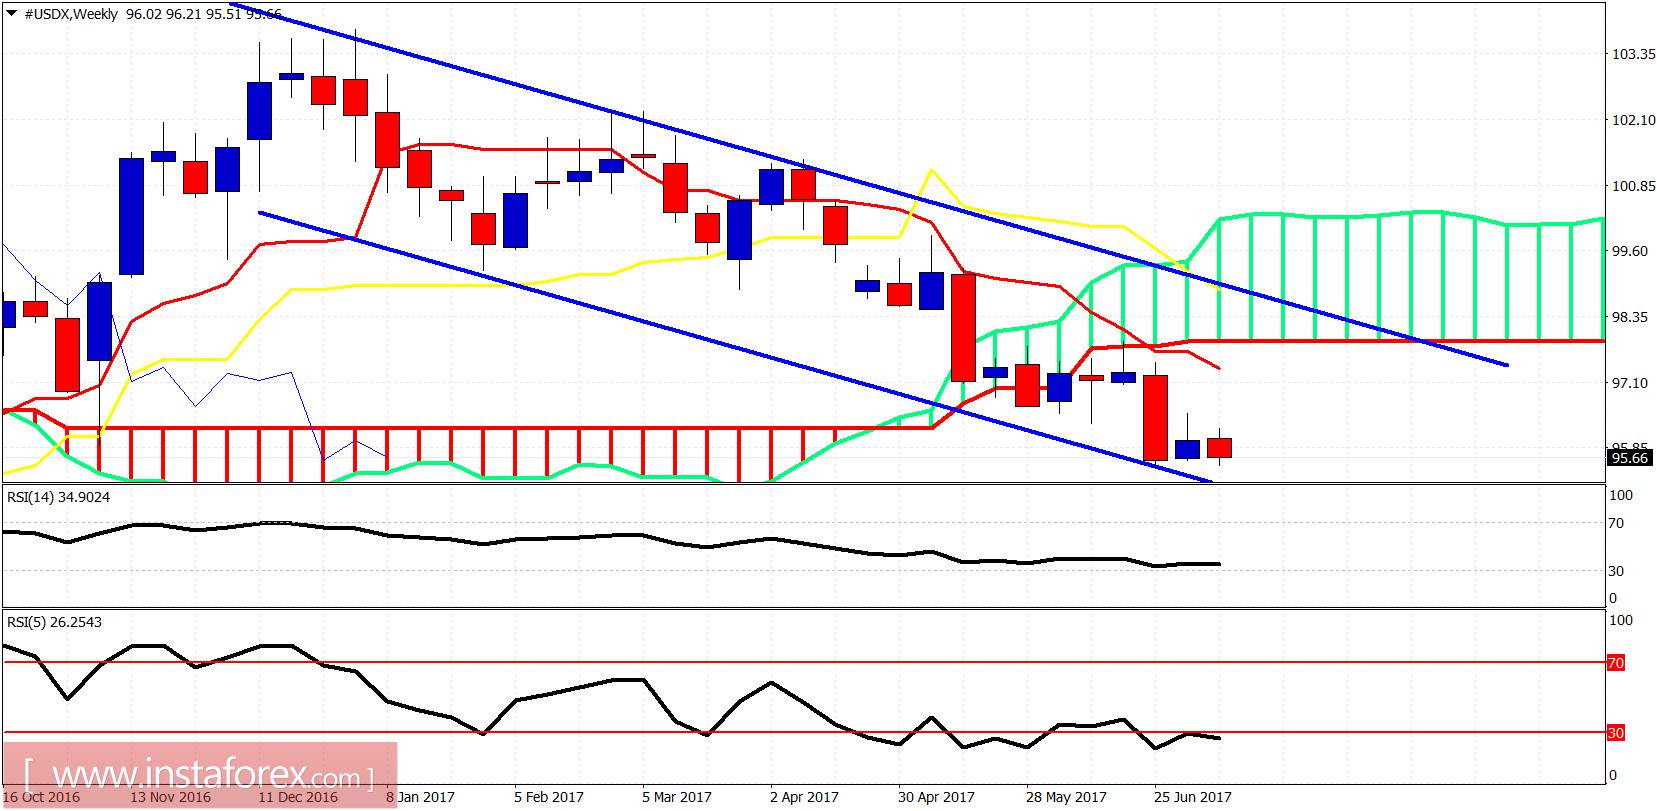
Nothing new on the weekly chart where we see price below the weekly Kumo (cloud), inside the bearish channel, very close to the lower channel boundary and the RSI (5) diverging. I continue to expect a bounce towards 97.70-98 over the coming weeks.