 English
  Русский
 Bahasa Indonesia
 Bahasa Malay
 ไทย
ไทย Español
 Deutsch
 Български
 Français
 Tiếng Việt
 中文
中文 বাংলা
বাংলা हिन्दी
 Čeština
 Українська
 Română

The Gold price bounced towards the upper channel boundary and resistance area of $1,230 and got rejected. The price has turned back lower towards $1,215. Gold bulls need to break above $1,230 in order to confirm that an important low is in.
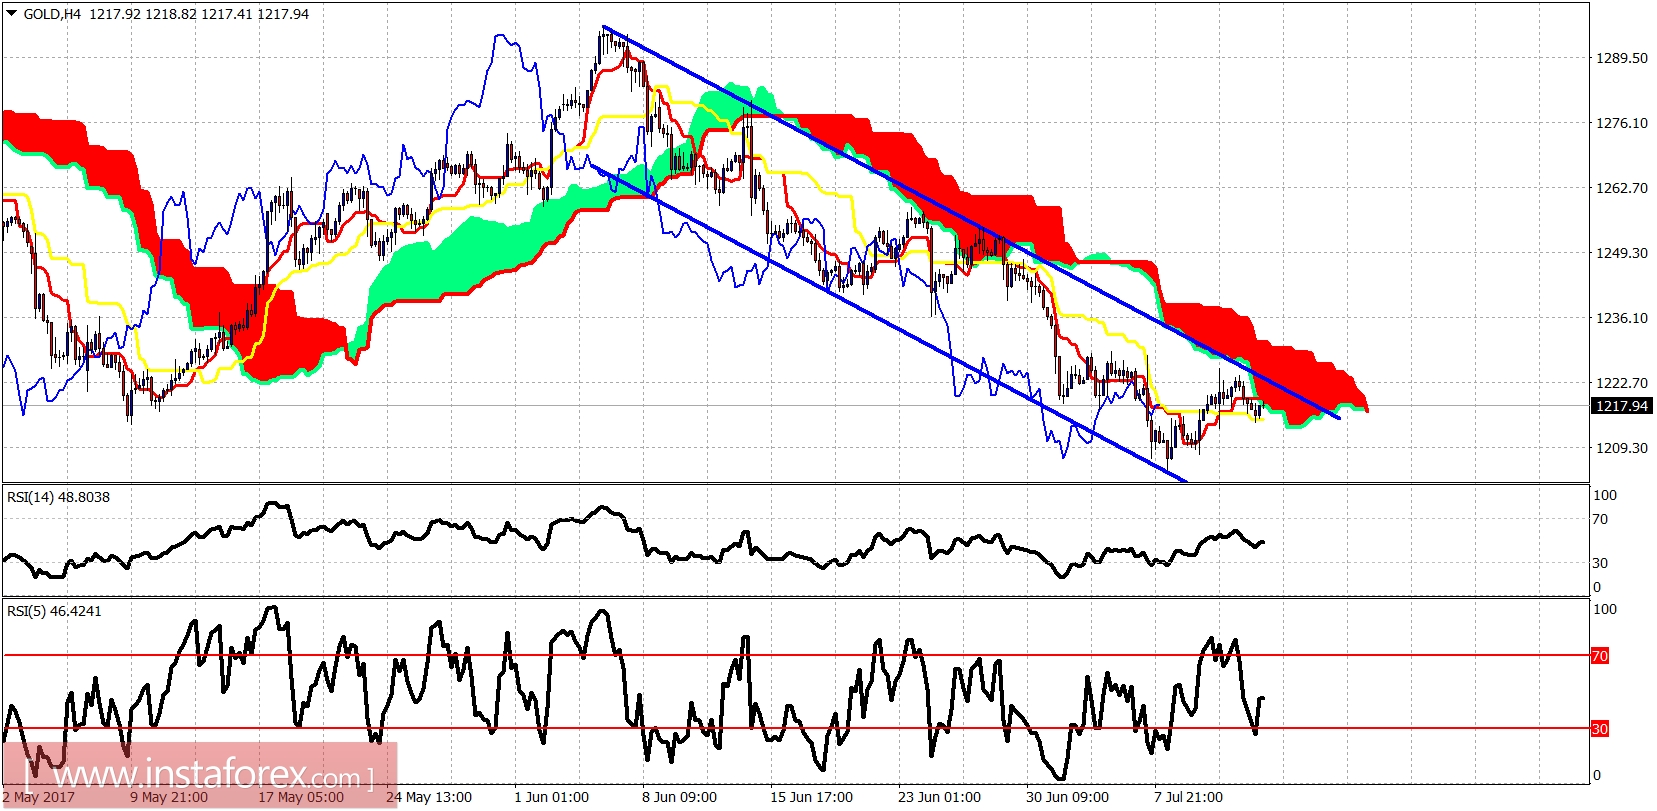
The Gold price is below the Kumo (cloud) and still inside the bearish channel. Support is at $1,205 and next support is at $1,190. Resistance is at $1,230.
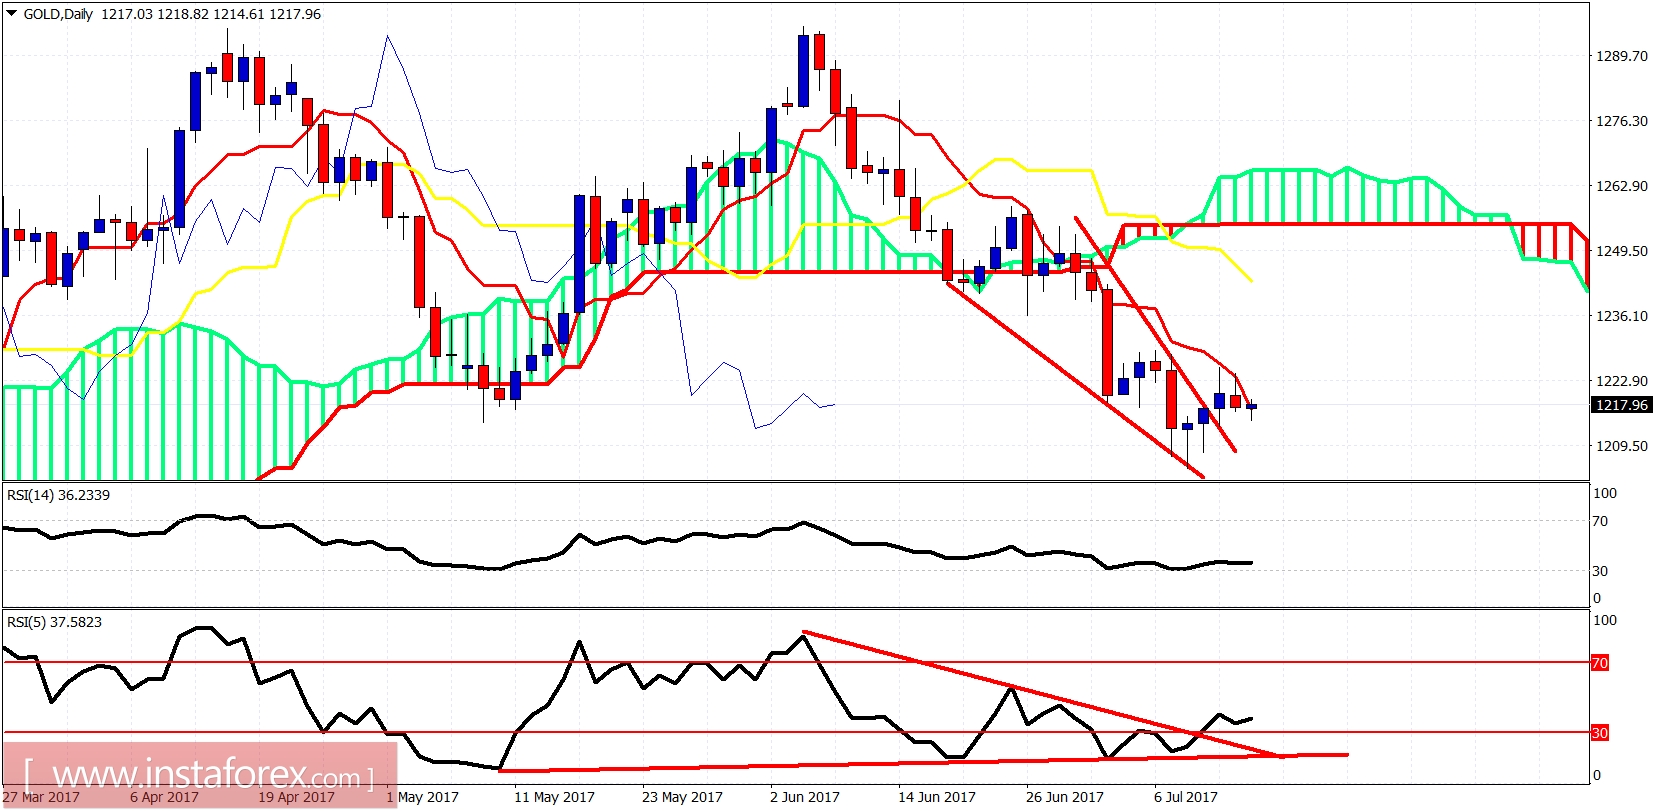
The Gold price broke out of the downward sloping wedge pattern but the tenkan-sen (red line indicator) is providing important resistance and bulls cannot overcome this obstacle...yet. I believe that eventually the Gold price will turn back again upwards and break above $1,230 and move at least towards $1,260.