 English
  Русский
 Bahasa Indonesia
 Bahasa Malay
 ไทย
ไทย Español
 Deutsch
 Български
 Français
 Tiếng Việt
 中文
中文 বাংলা
বাংলা हिन्दी
 Čeština
 Українська
 Română

The index still is moving in sideways below the 200 SMA at H1 chart and looks for a clear catalyst that triggers more sell orders in the greenback. Overall, our outlook remains bearish as long as USDX attempts to break below the 95.77 level. If that happens, further weakness will be seen towards 95.10. MACD indicator seems to be favoring that scenario.
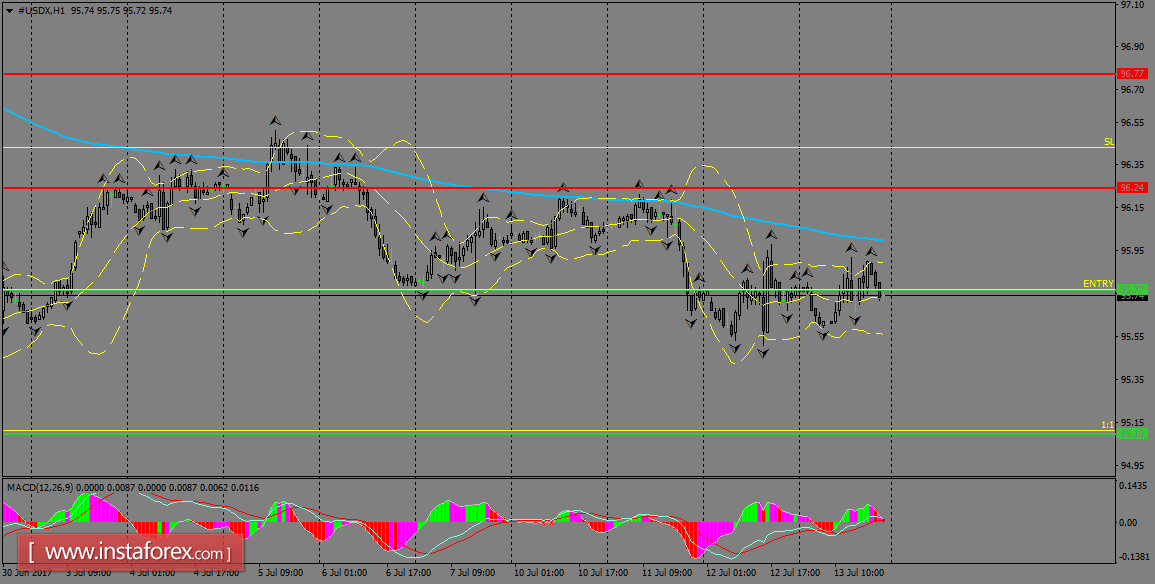
H1 chart's resistance levels: 96.77 / 97.20
H1 chart's support levels: 96.38 / 95.77
Trading recommendations for today: Based on the H1 chart, place sell (short) orders only if the USD Index breaks with a bearish candlestick; the support level is at 95.77, take profit is at 95.10 and stop loss is at 96.42.