 English
  Русский
 Bahasa Indonesia
 Bahasa Malay
 ไทย
ไทย Español
 Deutsch
 Български
 Français
 Tiếng Việt
 中文
中文 বাংলা
বাংলা हिन्दी
 Čeština
 Українська
 Română

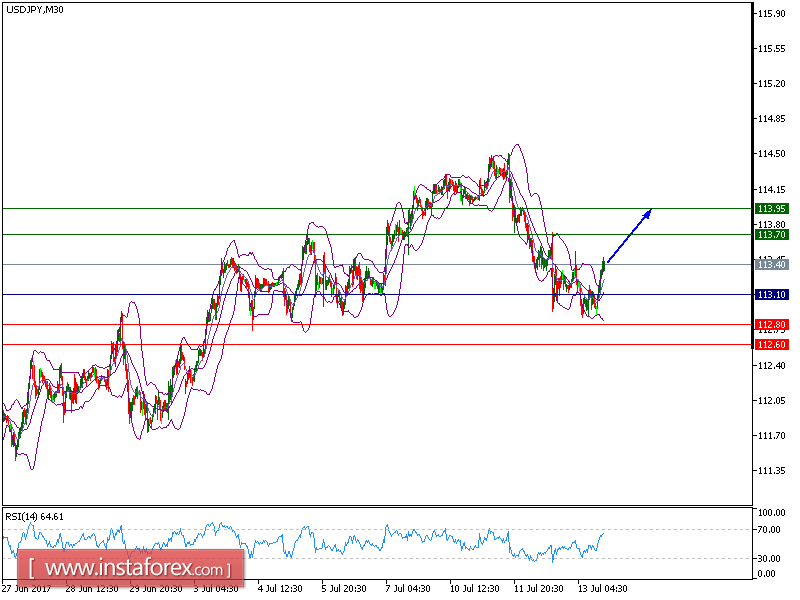
Our targets which we determined in yesterday's analysis have been hit. The pair is trading above its declining 50-period moving average, which is playing a support role. The RSI is above its neutrality level at 50. In addition, 113.10 is playing a key support role, which should limit the downside potential.
Alternatively, if the price moves in the opposite direction than predicted, a downside position is recommended above 113.10 with a target at 112.80.
Chart Explanation: The black line shows the pivot point. The current price above the pivot point indicates a bullish position while the price below the pivot point is a sign for a short position. The red lines show the support levels and the green line indicates the resistance level. These levels can be used to enter and exit trades.
Strategy : BUY , Stop Loss: 114, Take Profit: 114.90
Resistance levels: 113.70, 113.95, and 114.20
Support levels: 112.80,112.60, and 112.40