 English
  Русский
 Bahasa Indonesia
 Bahasa Malay
 ไทย
ไทย Español
 Deutsch
 Български
 Français
 Tiếng Việt
 中文
中文 বাংলা
বাংলা हिन्दी
 Čeština
 Українська
 Română

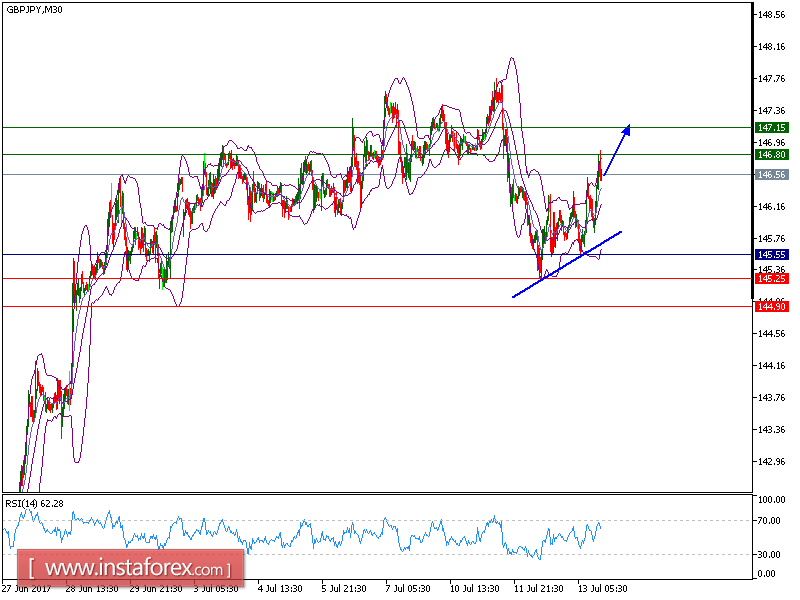
Our take profit target which we mentioned in yesterday's analysis has been hit. The pair signals further upside potential after its upward breakout of a bullish channel. The rising 20-period and 50-period moving averages are playing support roles and maintain the upside bias. The RSI is above its neutrality level at 50.
As long as 145.55 is seen as support, look for a further advance towards 146.80 and even 147.15.
Alternatively, if the price moves in the opposite direction as predicted, a short position is recommended below 145.55 with the target at 145.25.
Chart Explanation: the black line shows the pivot point. The price above pivot point indicates the bullish position and when it is below pivot points, it indicates a short position. The red lines show the support levels and the green line indicates the resistance levels. These levels can be used to enter and exit trades.
Strategy: BUY, Stop Loss: 145.55, Take Profit: 146.80.
Resistance levels: 146.80, 147.15, and 147.50
Support levels: 145.25, 144.90, and 144.00