 English
  Русский
 Bahasa Indonesia
 Bahasa Malay
 ไทย
ไทย Español
 Deutsch
 Български
 Français
 Tiếng Việt
 中文
中文 বাংলা
বাংলা हिन्दी
 Čeština
 Українська
 Română

USDX continues to ride the bearish side and the consolidation below the 200 SMA at H1 chart still prevails. To the downside, we might expect a testing of the 95.10 level, but we would need to wait for a confirmation from the MACD indicator, which is still in the positive territory. In the bullish path, closest resistance is placed in the 200 SMA zone.
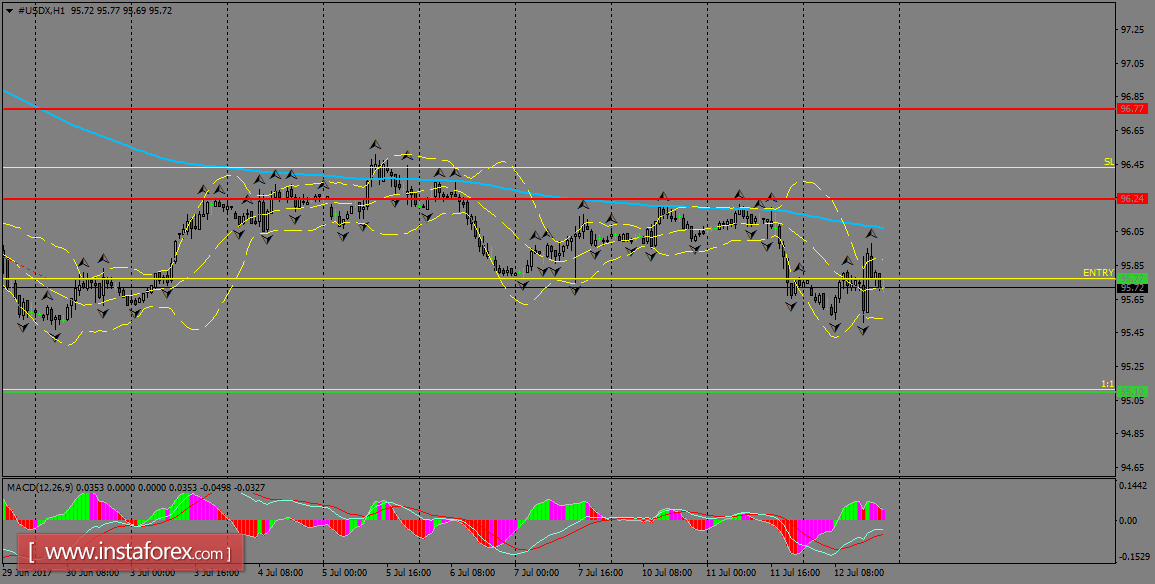
H1 chart's resistance levels: 96.77 / 97.20
H1 chart's support levels: 96.38 / 95.77
Trading recommendations for today: Based on the H1 chart, place sell (short) orders only if the USD Index breaks with a bearish candlestick; the support level is at 95.77, take profit is at 95.10 and stop loss is at 96.42.