 English
  Русский
 Bahasa Indonesia
 Bahasa Malay
 ไทย
ไทย Español
 Deutsch
 Български
 Français
 Tiếng Việt
 中文
中文 বাংলা
বাংলা हिन्दी
 Čeština
 Українська
 Română

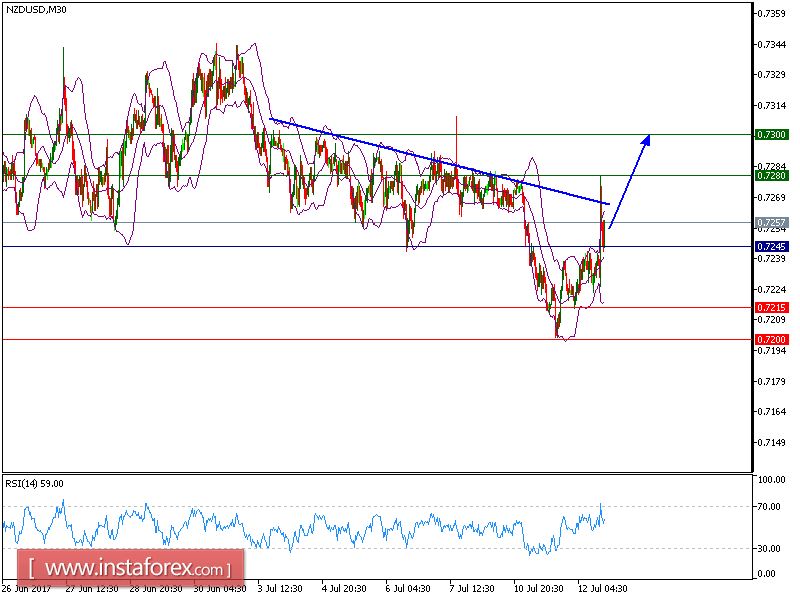
NZD/USD is expected to trade with a bullish outlook. Although the pair posted a pullback from 0.7240, it is still trading above the key support at 0.7200 (the low of July 11), which should limit the downside potential. Even though a continuation of the consolidation cannot be ruled out, its extent should be limited.
To conclude, as long as 0.7245 is not broken, look for a rebound with targets at 0.7280 and 0.7300 in extension.
Strategy: BUY Stop Loss: 0.7245 Take Profit: 0.7280
Chart Explanation: The black line shows the pivot point. Currently, the price is above the pivot point which indicates the bullish position. If it is below the pivot points, it indicates the short position. The red lines show the support levels and the green line indicates the resistance levels. These levels can be used to enter and exit trades.
Resistance levels: 0.7280, 0.7300, and 0.7375
Support levels: 0.7215, 0.7200, and 0.7165