 English
  Русский
 Bahasa Indonesia
 Bahasa Malay
 ไทย
ไทย Español
 Deutsch
 Български
 Français
 Tiếng Việt
 中文
中文 বাংলা
বাংলা हिन्दी
 Čeština
 Українська
 Română

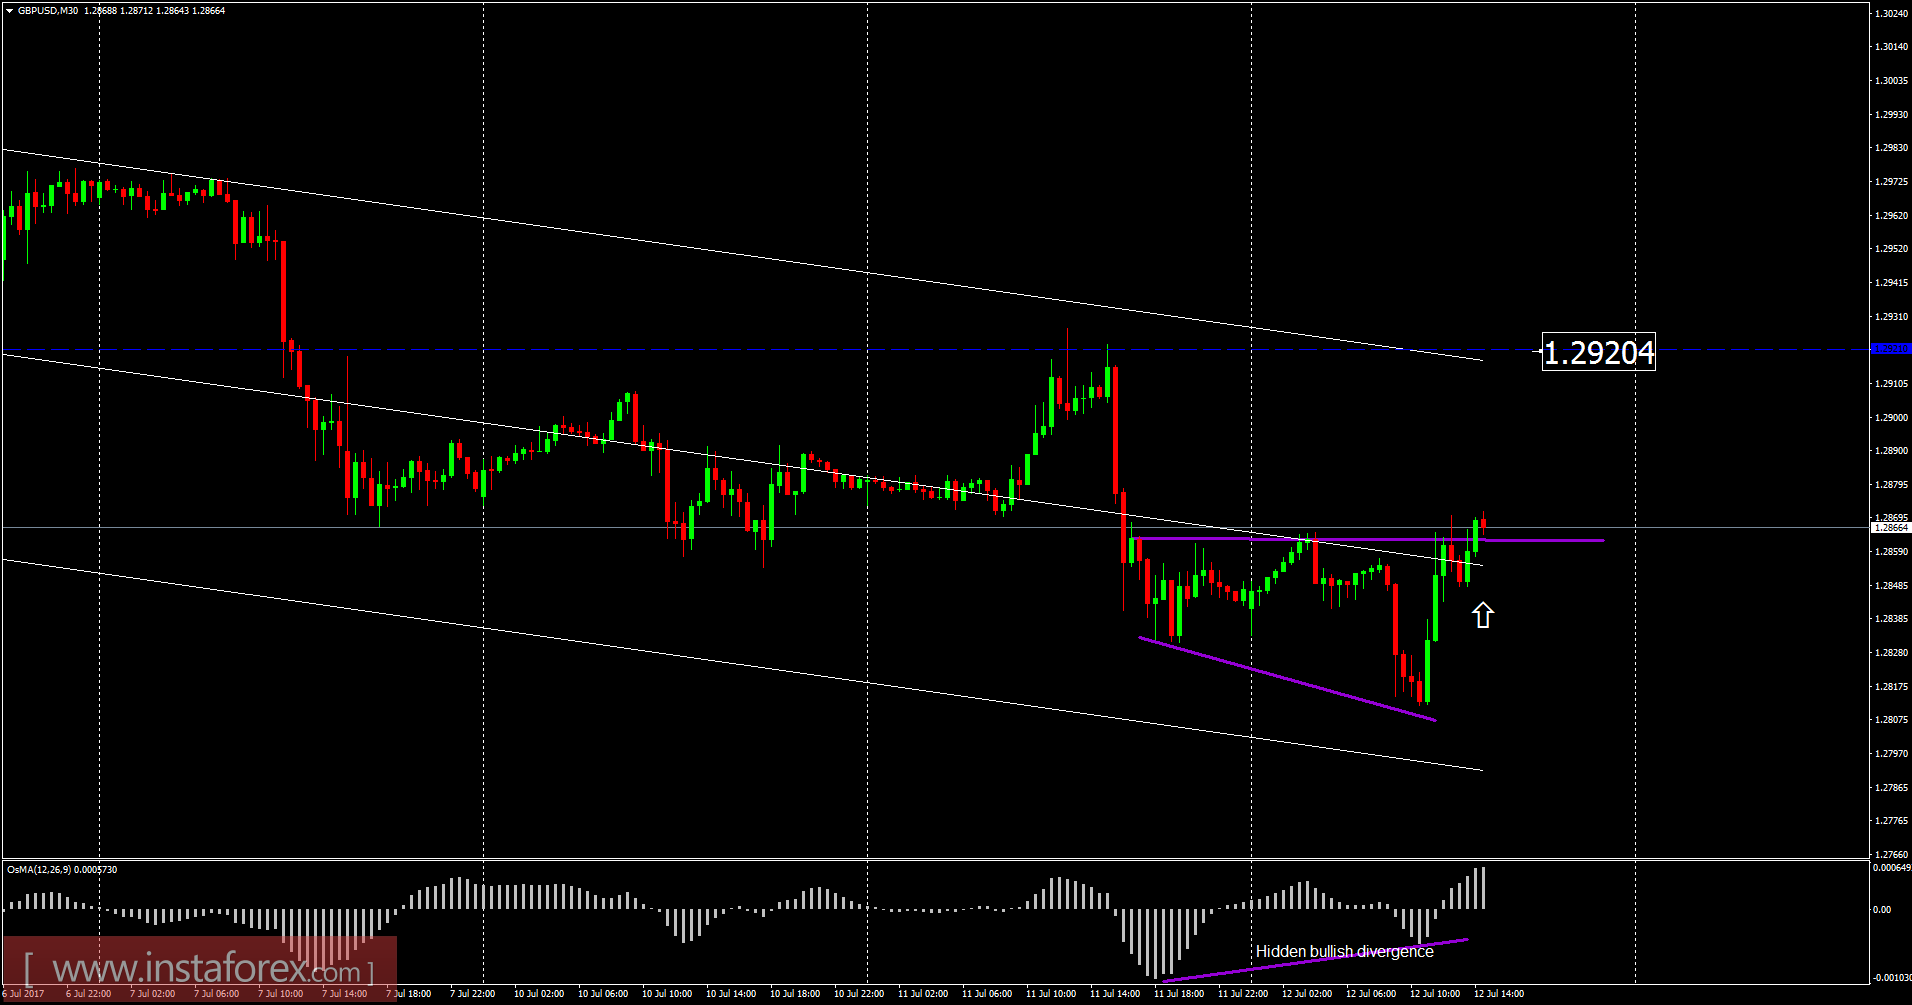
Recently, the GBP/USD has been trading sideways at the price of 1.2865. According to the 30M time frame, I found confirmed double bottom formation and fake breakout of yesterday's low, which is a sign that selling looks risky. I also found a hidden bullish divergence on the moving average oscillator, which is another sign of strength. My advice is to watch for potential buying opportunities. The upward target is set at the price of 1.2920.
Resistance levels:
R1: 1.2875
R2: 1.2900
R3: 1.2925
Support levels:
S1: 1.2820
S2: 1.2790
S3: 1.2770
Trading recommendations for today: watch for potential buying opportunities.