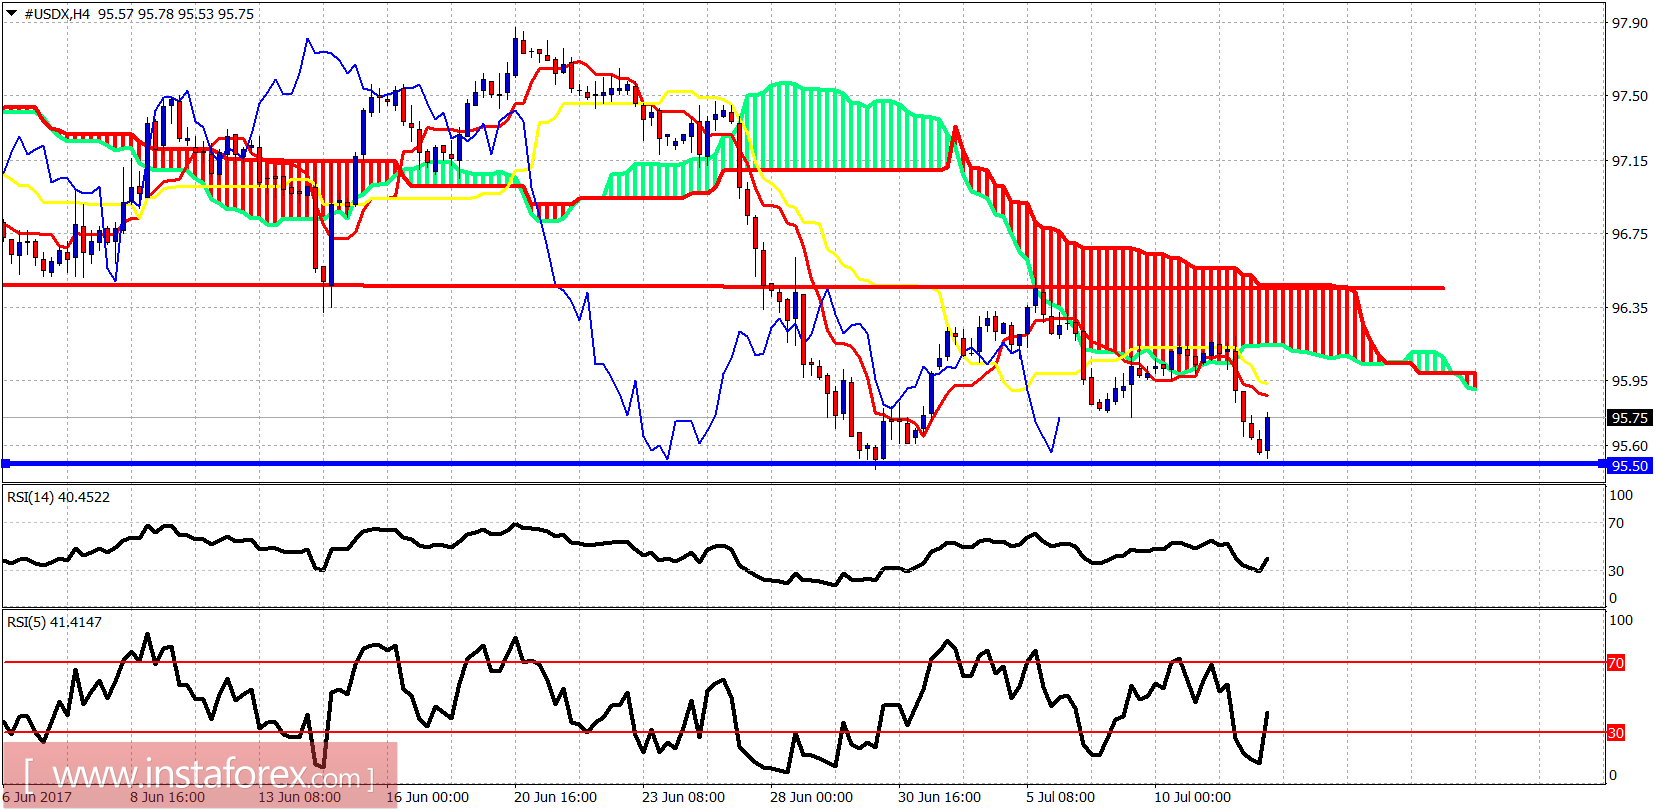
The Dollar index got rejected from the short-term cloud resistance at 96.30 and pulled back towards its recent lows at 95.50. A possible double bottom formation could be in play as price is bouncing off the previous lows.

Blue line - support
The Dollar index is bouncing off the previous lows at 95.50 which is also a support level. Short-term resistance is at 96.15. Breaking it will increase dramatically the chances of breaking above 96.50 and moving towards 98.

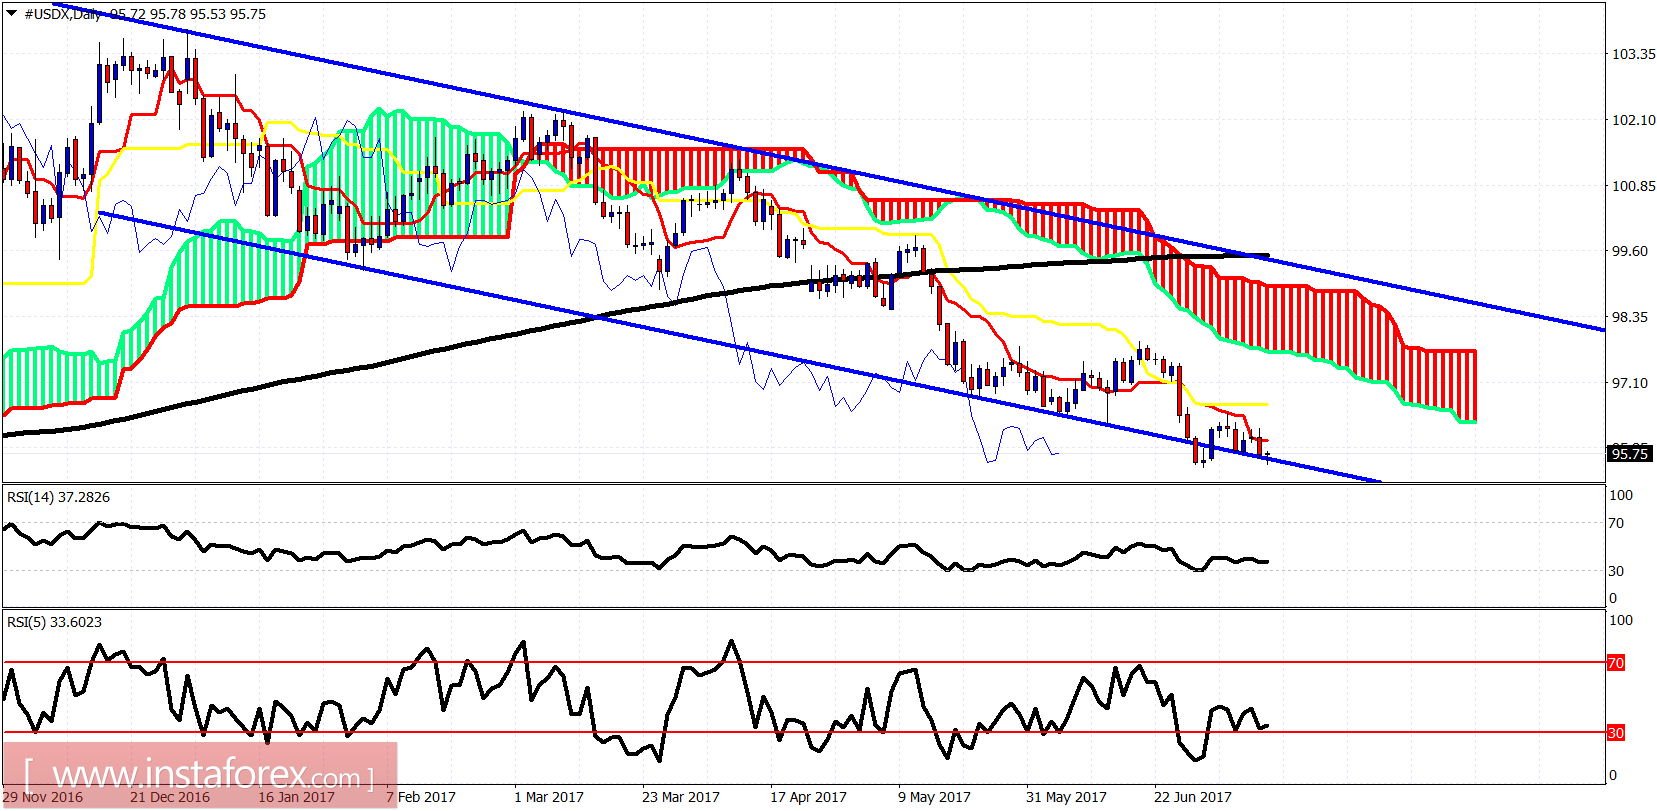
The Dollar index continues to trade right on top of the lower channel boundary. Daily resistance is at 96-96.50. Breaking it will open the way for a push higher towards 97.60.
 English
 Русский
 Bahasa Indonesia
 Bahasa Malay
 ไทย
ไทย Español
 Deutsch
 Български
 Français
 Tiếng Việt
 中文
中文 বাংলা
বাংলা हिन्दी
 Čeština
 Українська
 Română

