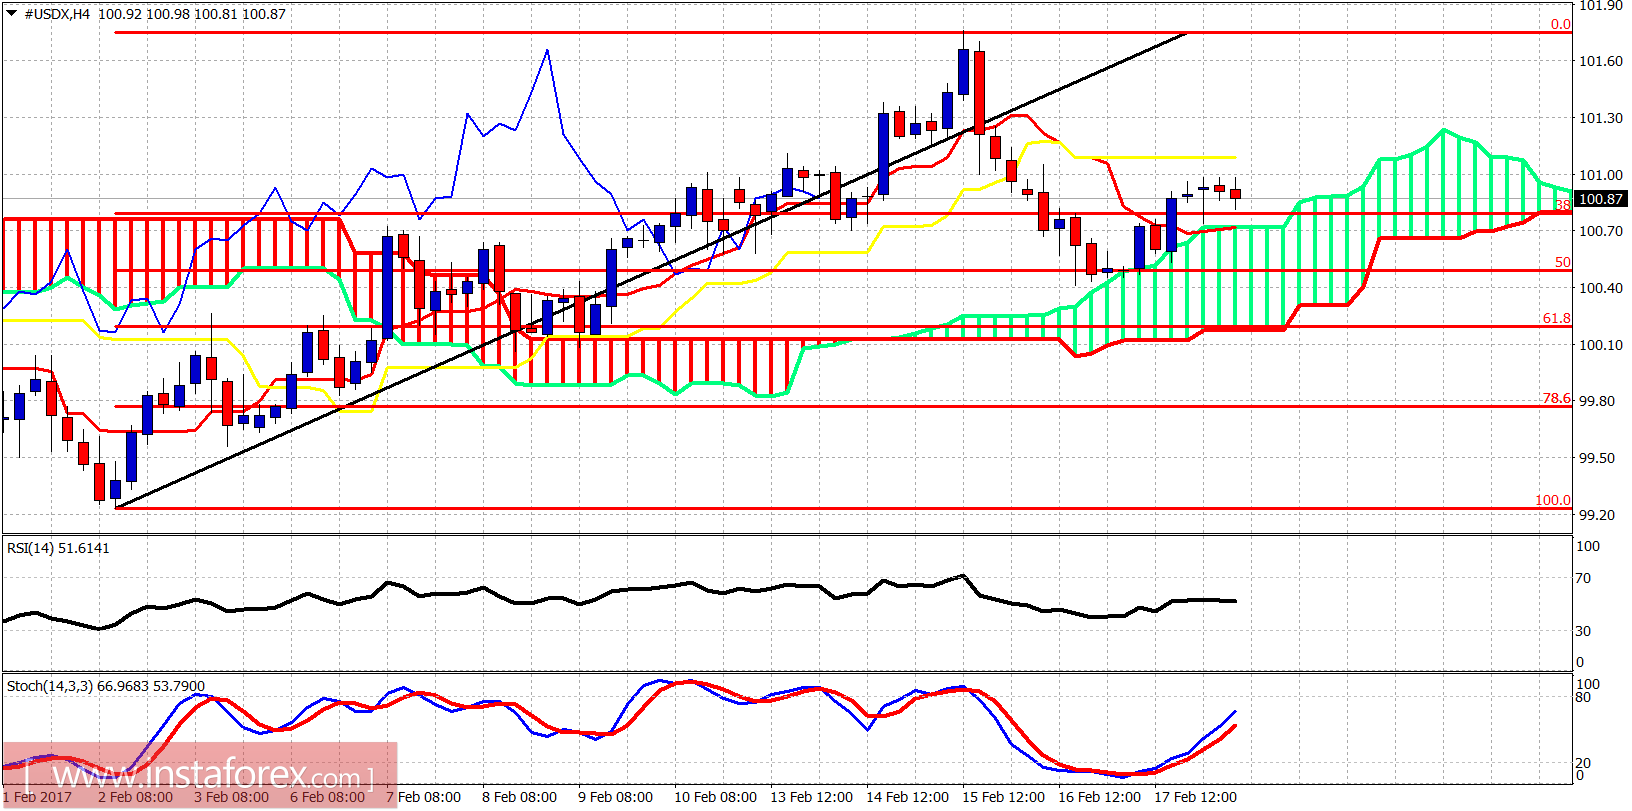
The Dollar index bounced off the cloud support as we expected in our last analysis. The Dollar index needs to break above 101.80 in order to confirm medium-term low at 99.25 and the start of a new uptrend targeting 105-110.

The Dollar index bounced off the 50% retracement and off the 4 hour Ichimoku cloud support. The price is now testing the kijun-sen resistance (yellow line indicator) at 101.10. Breaking above on a 4-hour close, will open the way for a push higher above 101.70. Support is at 100.70. If it is broken we should expect the Dollar index to move towards the 61.8% Fibonacci retracement support.
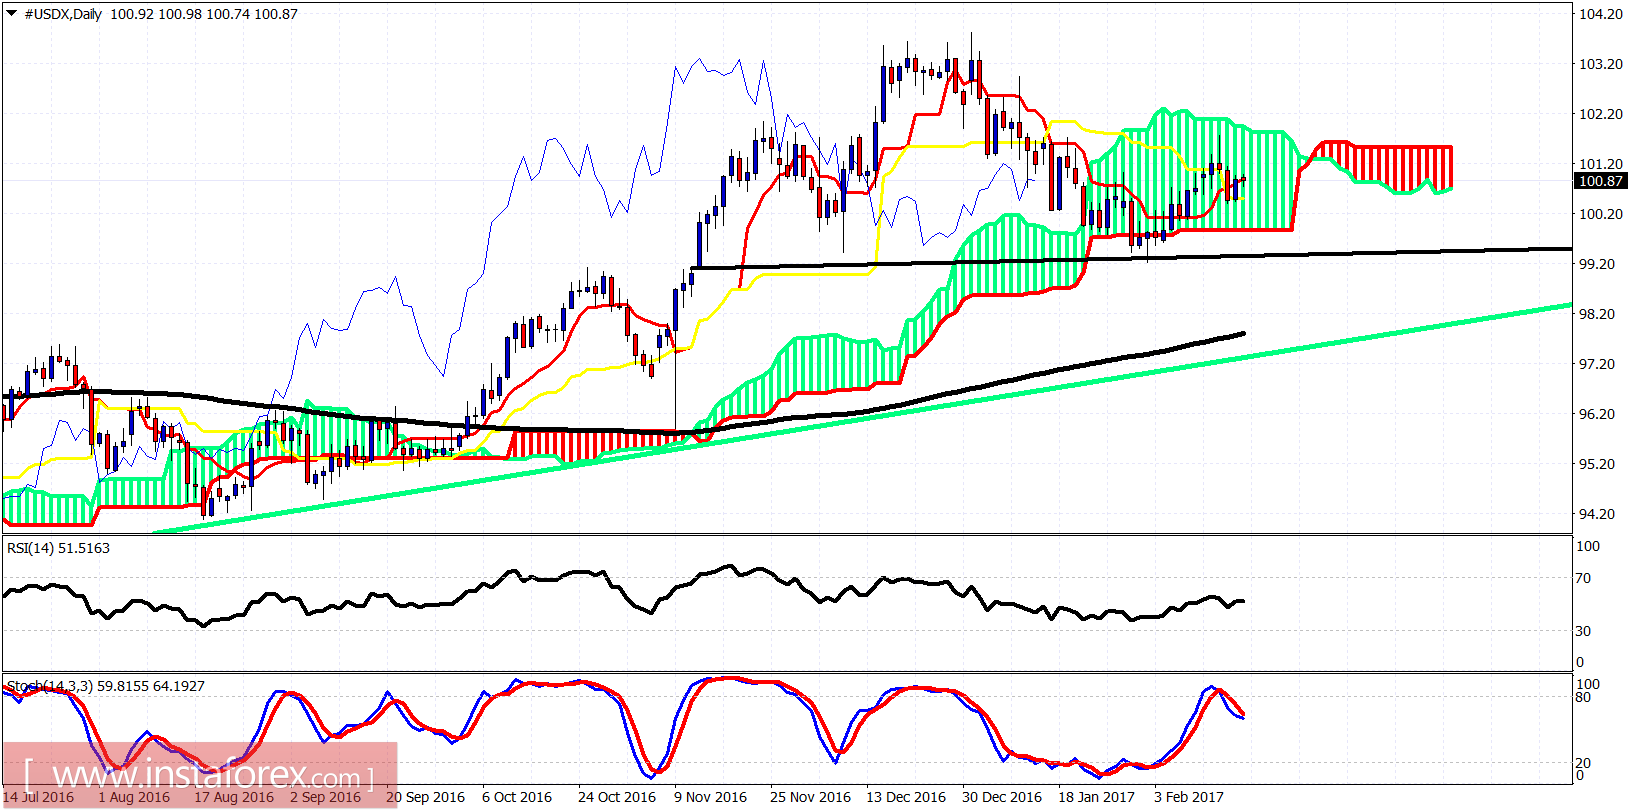
 Black line - neckline support
 Green line - long-term trendline support
On a daily basis the Dollar index is in neutral trend. The bulls need to break above 102 to regain control, while the bears need to break below the neckline in order to activate the Head and Shoulders pattern we mentioned again in our last analysis.
 English
 Русский
 Bahasa Indonesia
 Bahasa Malay
 ไทย
ไทย Español
 Deutsch
 Български
 Français
 Tiếng Việt
 中文
中文 বাংলা
বাংলা हिन्दी
 Čeština
 Українська
 Română

