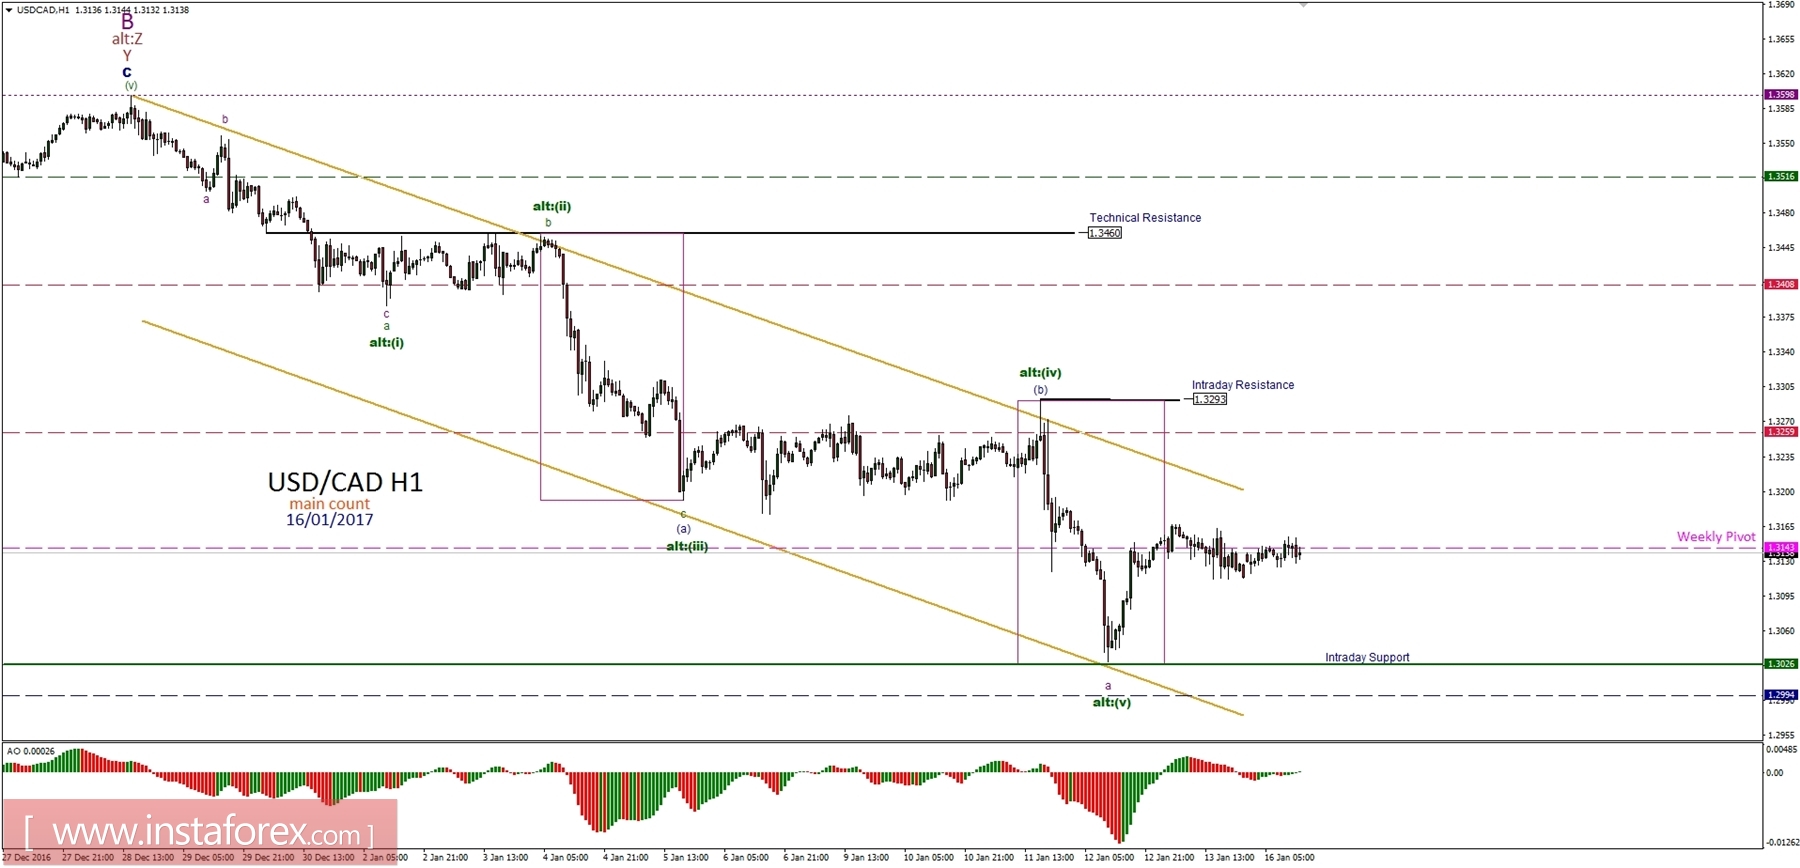
General overview for 16/01/2017:
The bottom of the wave a (purple) seems to be in place and now the market is trading around the weekly pivot at the level of 1.3143. It looks like the wave b (purple) is currently unfolding. Any violation of the intraday resistance at the level of 1.3293 will immediately invalidate the main count and the alternative scenario will replace it.
Support/Resistance:
1.2994 - WS1
1.3026 - Intraday Support
1.3143 - Weekly Pivot
1.3259 - WR1
1.3293 - Intraday Resistance
1.3408 - WR2
Trading recommendations:
Day traders should consider opening buy orders only if the level of 1.3293 is clearly violated. TP should be left open for now, while the first logical level is the weekly pivot resistance at the level of 1.3408.

 English
 Русский
 Bahasa Indonesia
 Bahasa Malay
 ไทย
ไทย Español
 Deutsch
 Български
 Français
 Tiếng Việt
 中文
中文 বাংলা
বাংলা हिन्दी
 Čeština
 Українська
 Română

