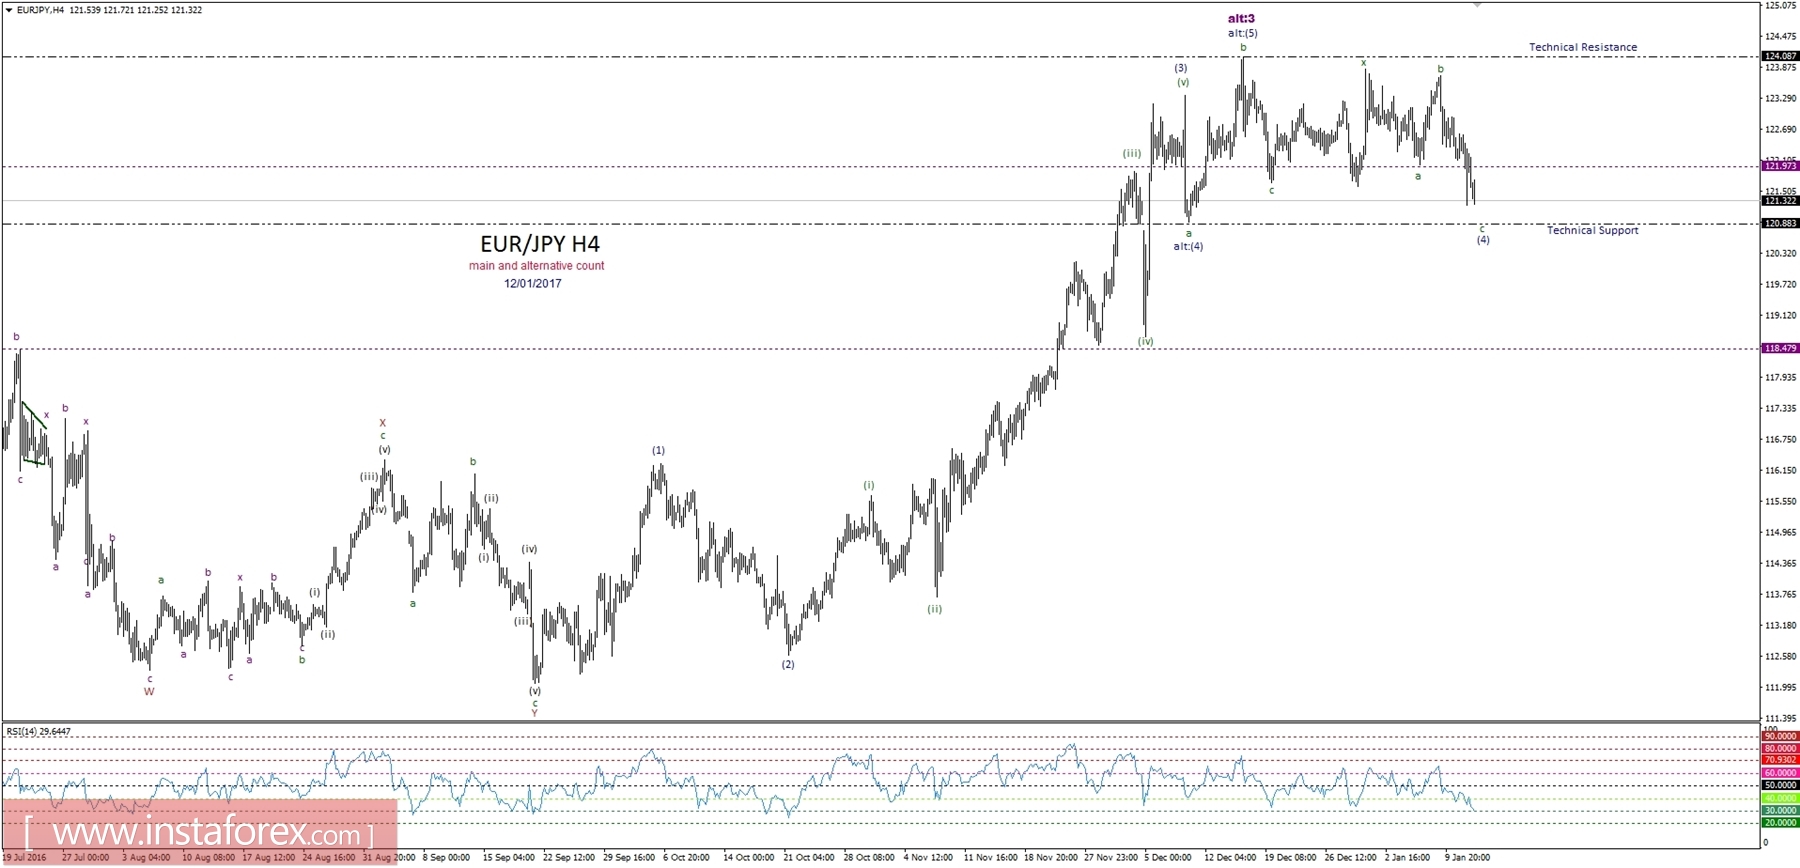
General overview for 12/01/2017:
The triangle pattern in the blue wave (4) has been invalidated as the market is now evolving into more complex correction. The current corrective structure looks more like a double three pattern and the market is in the last stages of this cycle. The projected target for the green wave c of this correction is at the level of 120.88 (technical support). The alternative count suggests the top for the purple wave 3 is in place already at the level of 124.08, so the current correction is just like the purple wave 4, but one degree higher. Anyway, regardless of the wave degree, there is still on more wave to the upside missing.
Support/Resistance:
124.08 - Swing High
121.97 - Intraday Resistance
120.88 - Intraday Support
Trading recommendations:
Day traders and swing traders should refrain from trading as the market is evolving into more complex corrective cycle which is full of whipsaws and false breakouts. Please wait for the next trading setup to occur shortly.

 English
 Русский
 Bahasa Indonesia
 Bahasa Malay
 ไทย
ไทย Español
 Deutsch
 Български
 Français
 Tiếng Việt
 中文
中文 বাংলা
বাংলা हिन्दी
 Čeština
 Українська
 Română

