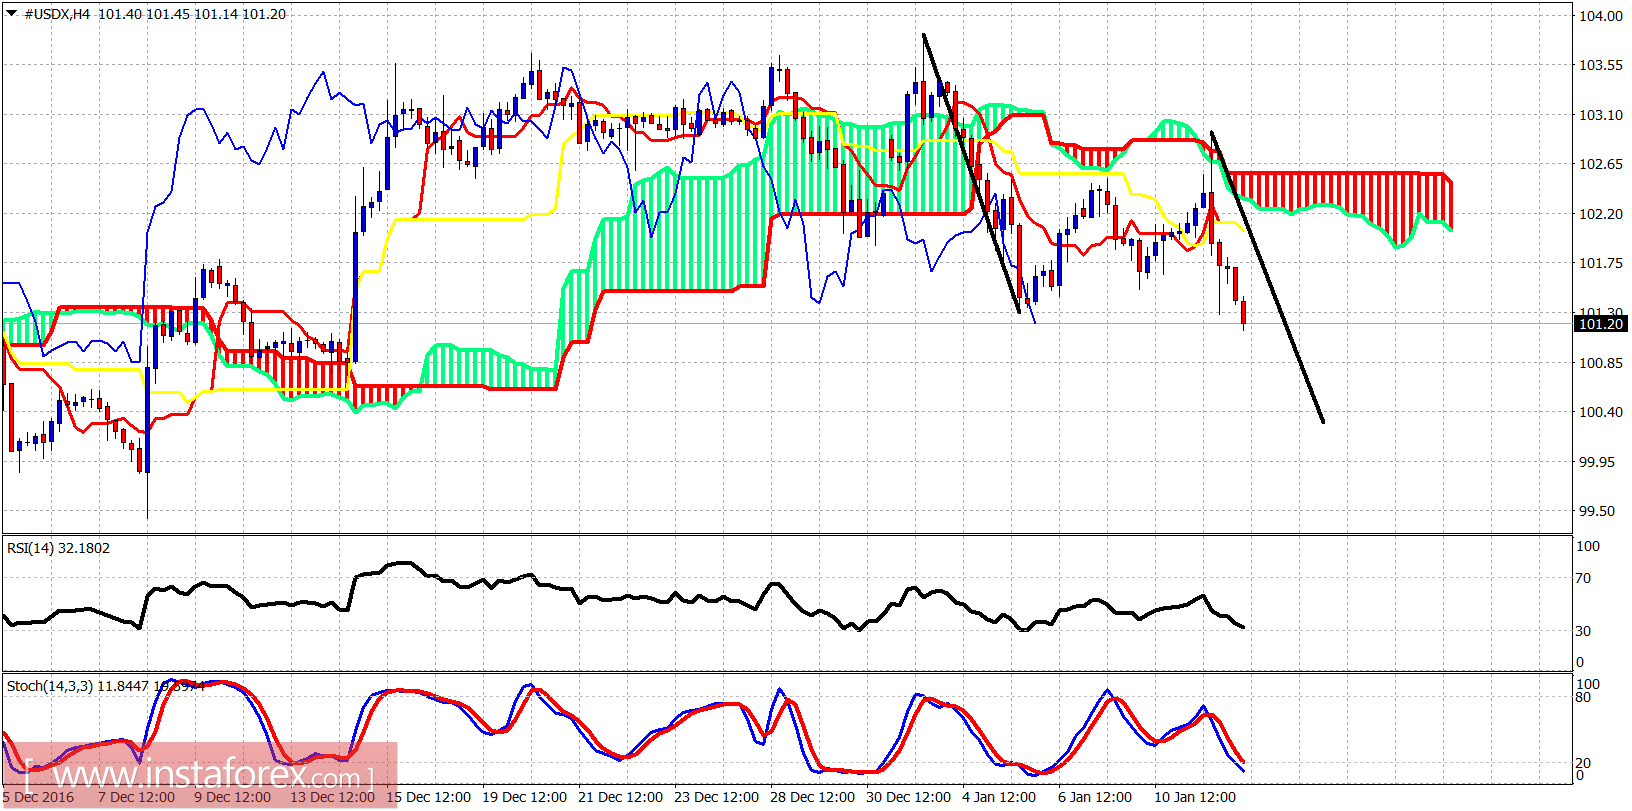
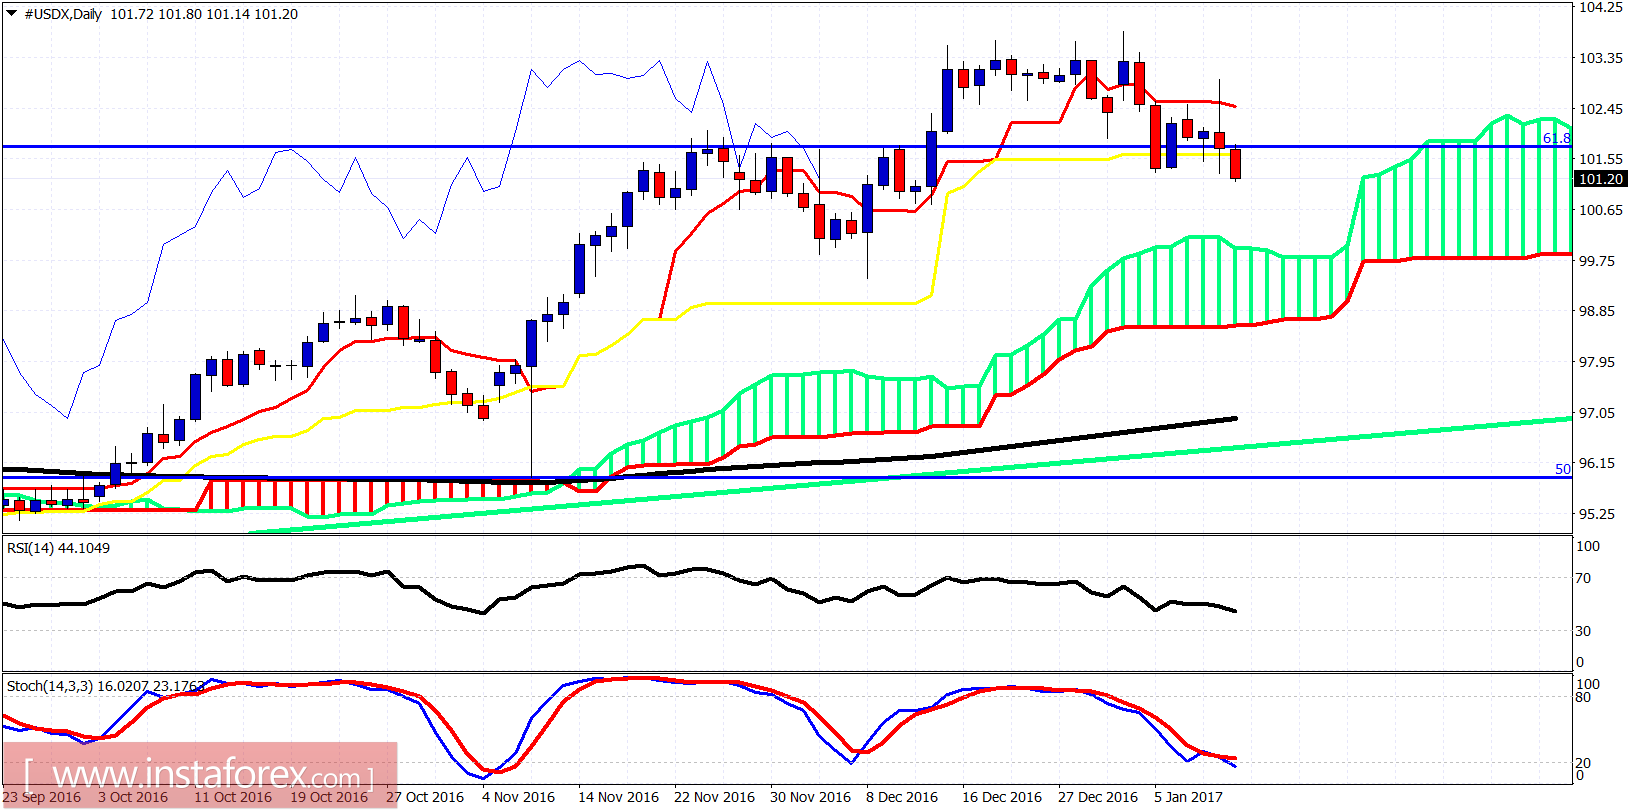
The Dollar index bounced towards resistance of 102.50 as expected after breaking the downward sloping resistance trend line at 102.10 and then got rejected according to our analysis expectations. The Dollar index is now making lower lows confirming a downtrend.

Black lines - price projection
The Dollar index has broken below support at 101.30 and is making new lows. The trend remains bearish. The Dollar index has 100.40 as the first target of the decline. Important resistance is at yesterday's highs. A break above yesterday's highs will increase the chances of new highs above 104 a lot.

key for this scenario is yesterday's high. As long as we are below it, the trend will remain bearish.
 English
 Русский
 Bahasa Indonesia
 Bahasa Malay
 ไทย
ไทย Español
 Deutsch
 Български
 Français
 Tiếng Việt
 中文
中文 বাংলা
বাংলা हिन्दी
 Čeština
 Українська
 Română

