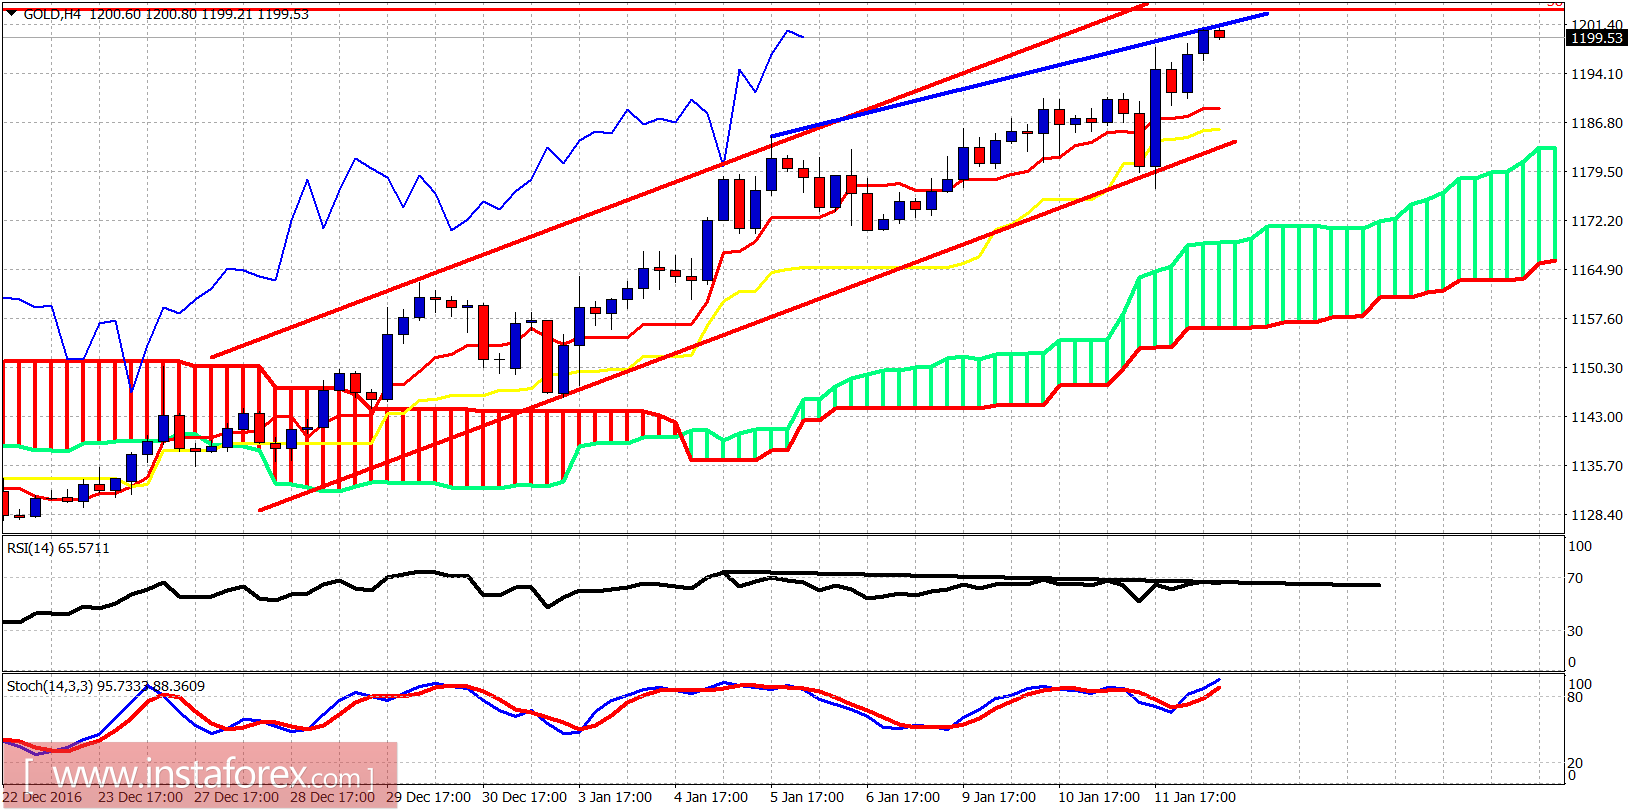
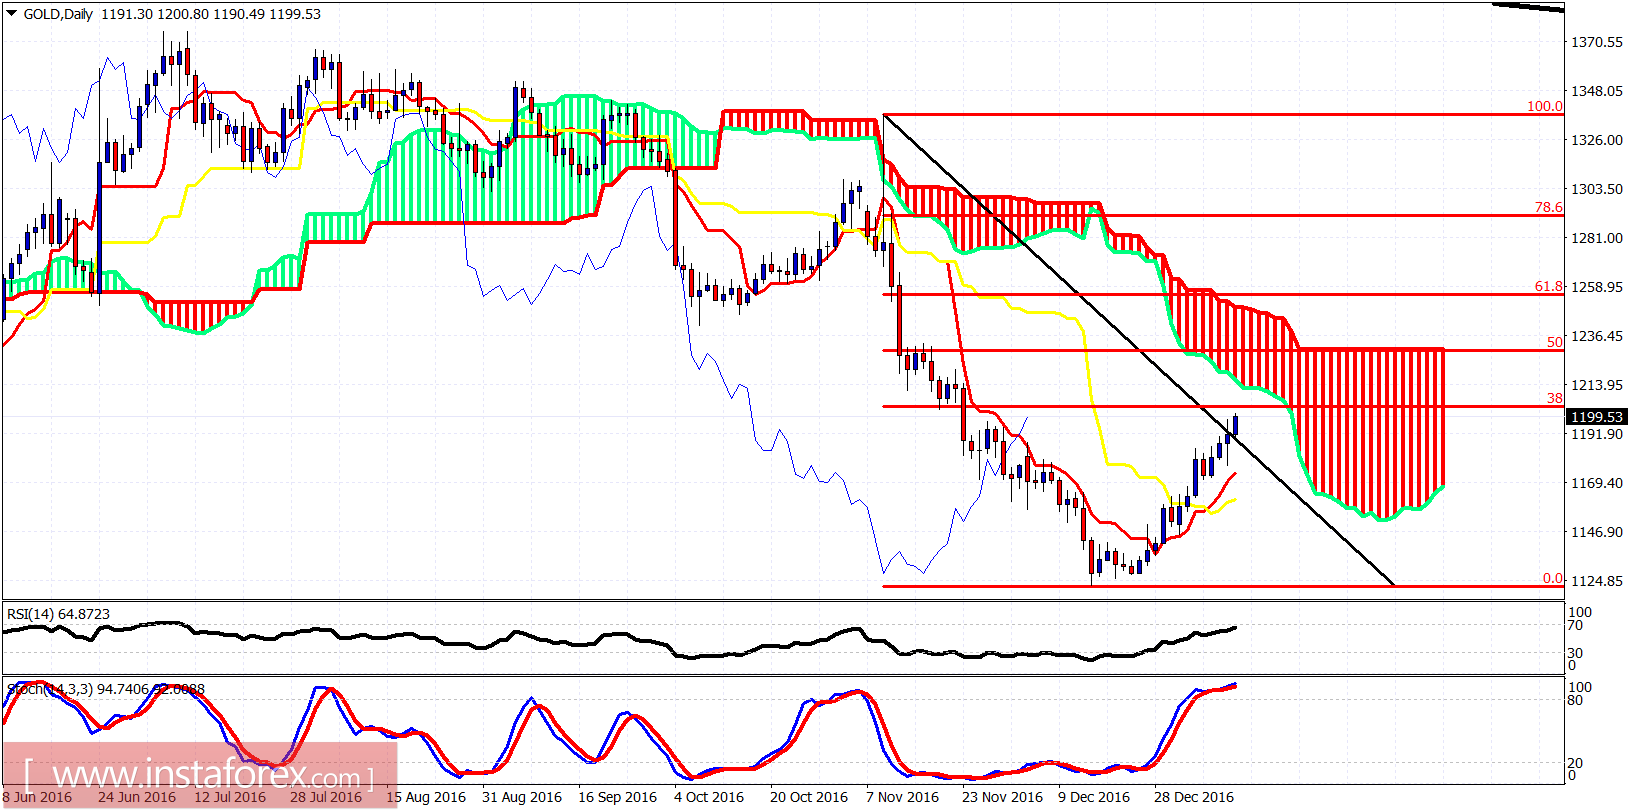
Gold price is making new highs at $1,200 as we have been expecting for some time now. Gold price could continue higher towards $1,220 but Gold bulls need to be very cautious as there are bearish short-term divergence signs. A pullback is justified towards $1,170-60.

Blue line- new highs
Black line - diverging RSI
Gold price continues to trade above the Ichimoku cloud and inside the red bullish channel. There are divergence signs in the 4-hour RSI and this is an important warning for the short-term momentum. We could see $1,210-20 but Gold bulls should be prepared for a pullback towards at least $1,170 where the 38% Fibonacci retracement is found.

 English
 Русский
 Bahasa Indonesia
 Bahasa Malay
 ไทย
ไทย Español
 Deutsch
 Български
 Français
 Tiếng Việt
 中文
中文 বাংলা
বাংলা हिन्दी
 Čeština
 Українська
 Română

