 English
  Русский
 Bahasa Indonesia
 Bahasa Malay
 ไทย
ไทย Español
 Deutsch
 Български
 Français
 Tiếng Việt
 中文
中文 বাংলা
বাংলা हिन्दी
 Čeština
 Українська
 Română

Trend Analysis
This week, the price from the 1.2915 level (closing of the last weekly candle) may start rising toward the target of 1.3013 – the upper fractal (red dashed line). Upon testing this level, the price may continue moving upward toward the target of 1.3117 – the 76.4% retracement level (blue dashed line).
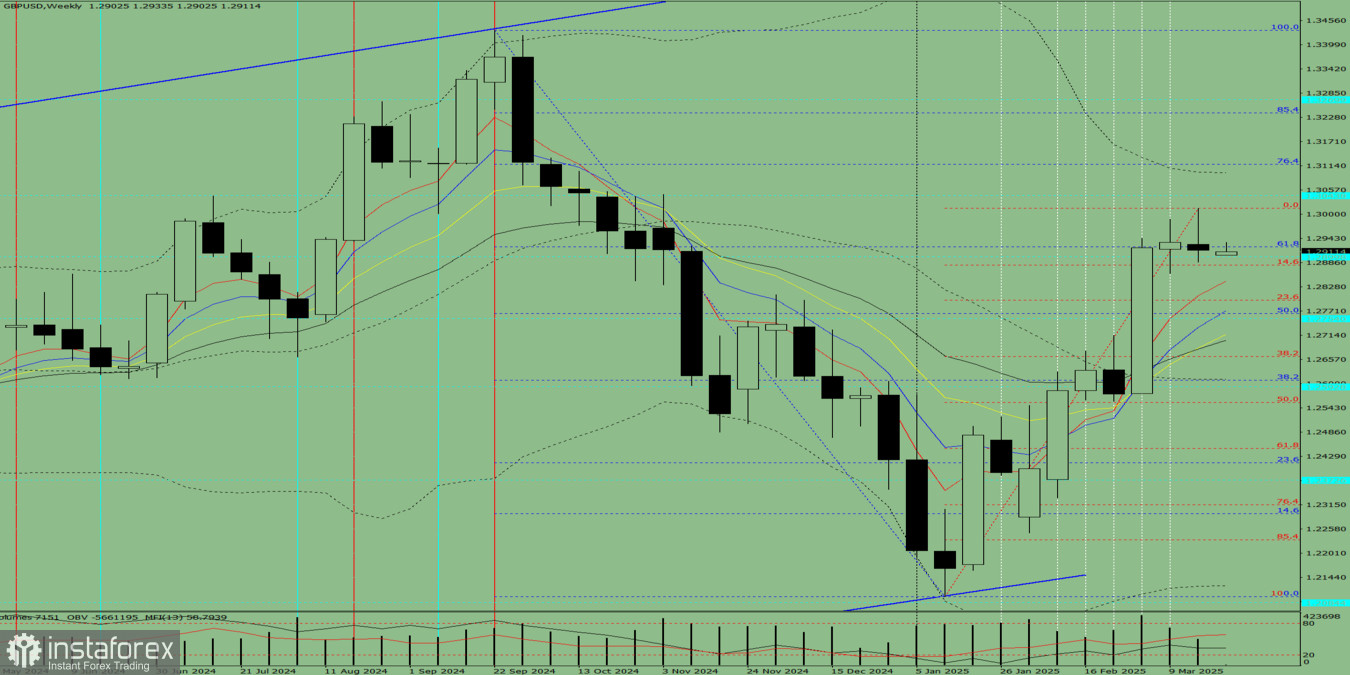
Fig. 1 (Weekly Chart)
Comprehensive Analysis:
- Indicator analysis – upward
- Fibonacci levels – upward
- Volume – upward
- Candlestick analysis – upward
- Trend analysis – upward
- Bollinger Bands – upward
- Monthly chart – upward
Conclusion based on comprehensive analysis: upward movement.
Overall forecast for the GBP/USD weekly candle: the price will most likely follow an upward trend during the week, with no lower shadow on the weekly white candle (Monday – upward movement) and a possible upper shadow (Friday – downward pullback).
Alternative scenario: the price from the 1.2915 level (closing of the last weekly candle) may start rising toward the 1.3013 upper fractal (red dashed line). Upon testing this level, the price may pull back to 1.2922 – the 61.8% retracement level (blue dashed line).