 English
  Русский
 Bahasa Indonesia
 Bahasa Malay
 ไทย
ไทย Español
 Deutsch
 Български
 Français
 Tiếng Việt
 中文
中文 বাংলা
বাংলা हिन्दी
 Čeština
 Українська
 Română

Trend Analysis:
This week, from the 1.2921 level (previous weekly candle close), the market may initially move downward toward 1.2857 – the 14.6% retracement level (red dashed line). After testing this level, the price is expected to resume its upward movement toward 1.3117 – the 76.4% retracement level (blue dashed line).
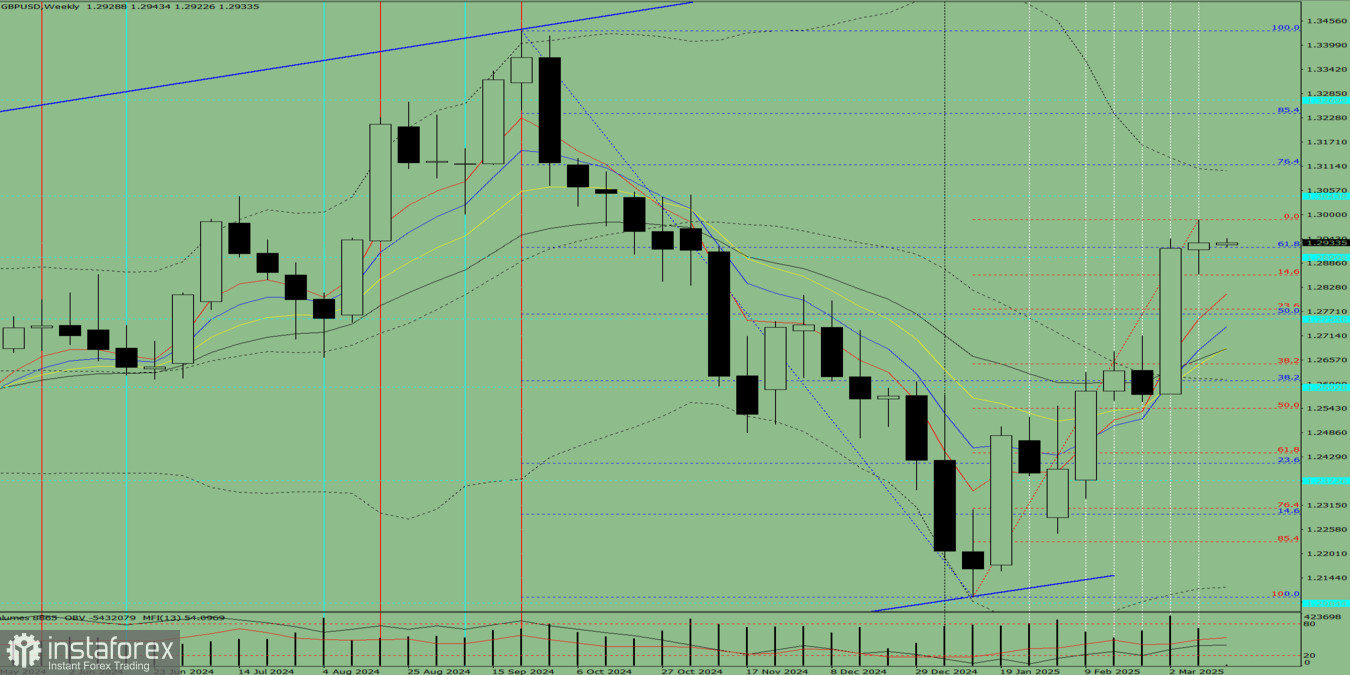
Fig. 1 (Weekly Chart)
Comprehensive Analysis:
- Indicator analysis: Bullish
- Fibonacci levels: Bullish
- Volume analysis: Bullish
- Candlestick analysis: Bullish
- Trend analysis: Bullish
- Bollinger Bands: Bullish
- Monthly chart: Bullish
Conclusion from Comprehensive Analysis:
The GBP/USD pair is expected to follow an upward trend during the week. The weekly candle is likely to have a lower shadow (Monday – downward movement) and a second upper shadow (Friday – downward movement), indicating initial weakness before resuming an uptrend.
Alternative Scenario:
If the price declines from 1.2921 (previous weekly close), it may target 1.2777 – the 23.6% retracement level (red dashed line). If this level is tested, the price may resume its upward movement toward 1.3044 – a historical resistance level (blue dashed line).