 English
  Русский
 Bahasa Indonesia
 Bahasa Malay
 ไทย
ไทย Español
 Deutsch
 Български
 Français
 Tiếng Việt
 中文
中文 বাংলা
বাংলা हिन्दी
 Čeština
 Українська
 Română

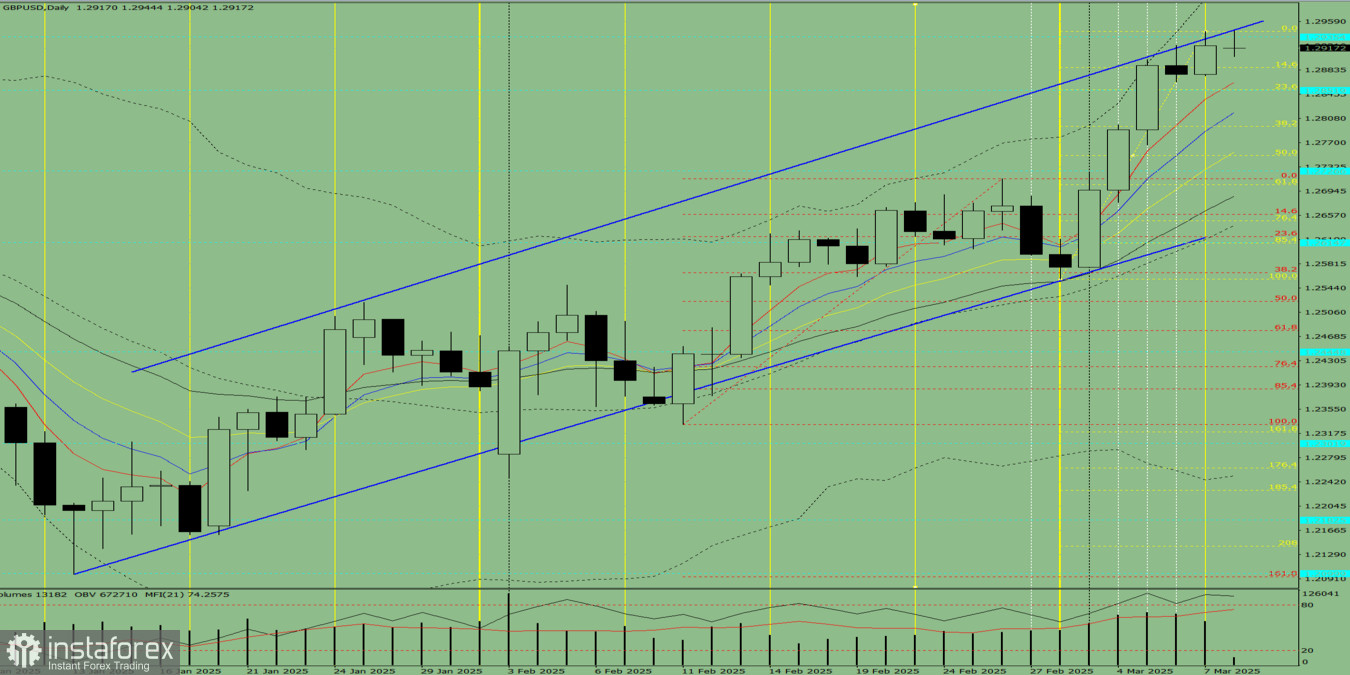
Trend Analysis (Fig. 1):
On Monday, the market, starting from 1.2921 (Friday's daily close), may begin moving downward toward 1.2887, which corresponds to the 14.6% retracement level (yellow dashed line). From this level, the price may then continue moving upward toward 1.2944, which aligns with the upper fractal (yellow dashed line).
Comprehensive Analysis:
- Indicator Analysis – Down
- Fibonacci Levels – Down
- Volume Analysis – Down
- Candlestick Patterns – Down
- Trend Analysis – Up
- Bollinger Bands – Down
- Weekly Chart – Down
Overall Conclusion: The general trend remains bearish.
Alternative Scenario:
If the price moves downward from 1.2921 (Friday's daily close), it may reach 1.2852 (the 23.6% retracement level, yellow dashed line). From this level, the price may then start an upward movement toward 1.2935, which serves as a historical support level (light blue dashed line).