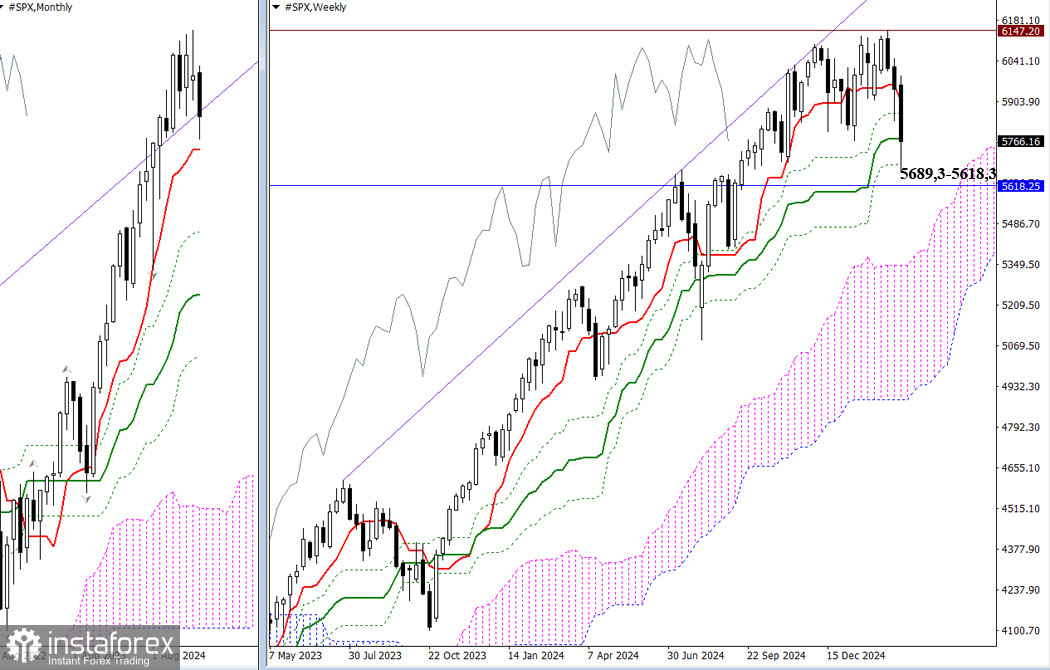
February's uncertainty has transitioned into a bearish correction in early March. Sellers are currently trying to break through the weekly golden cross at 5689.3 and test the monthly short-term trend at 5618.3. A solid consolidation below the nearest support zone (ranging from 5689.3 to 5618.3) could create new opportunities for bearish traders.

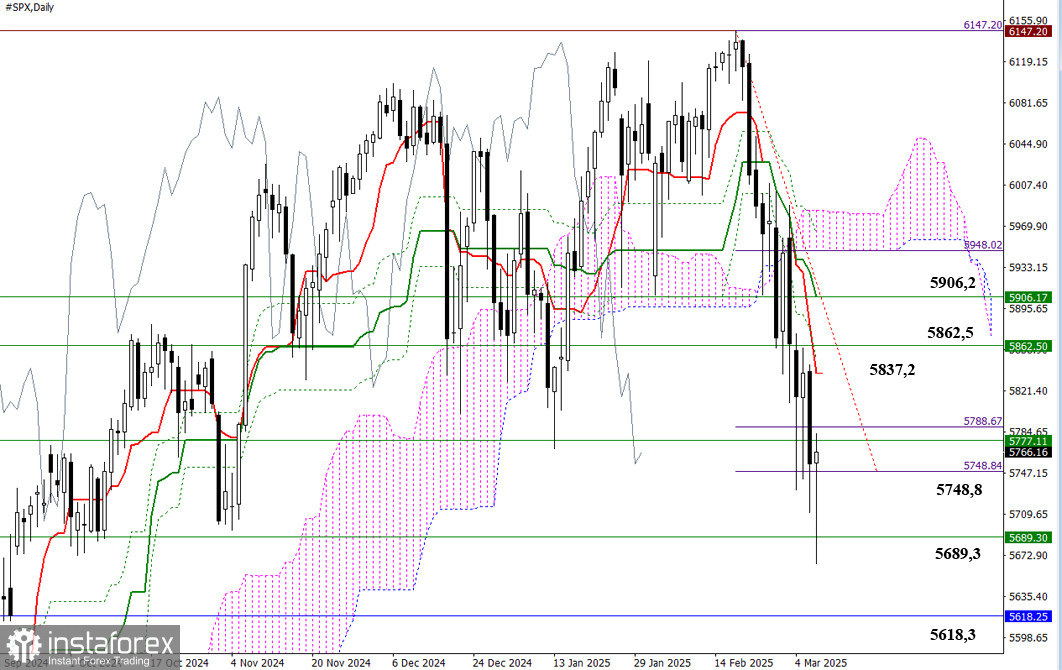
Alongside testing the supports of the weekly cross, the daily timeframe has also reached its target for breaking through the Ichimoku cloud at 5748.8. The current slowdown may lead to a retest of previously broken weekly levels, potentially triggering a daily corrective rally. The nearest reference point for this rally is the daily short-term trend at 5837.2.

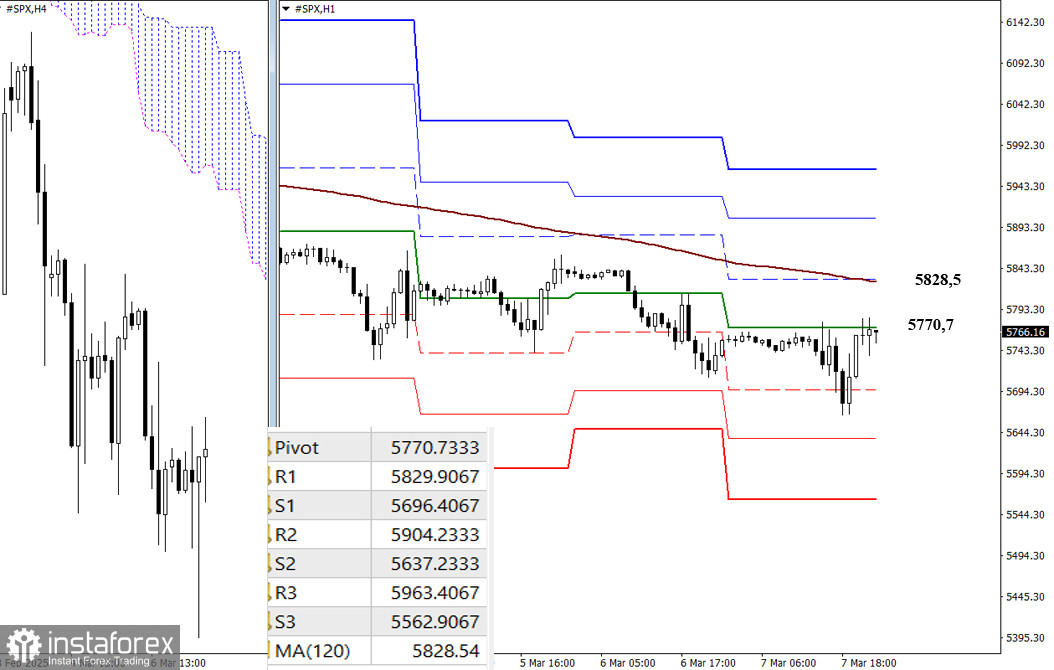
On lower timeframes, a consistent decline has formed a downward trend over the past few days. During corrective rallies, buyers have primarily been limited to testing the daily central pivot level, with the latest test occurring around 5770.7. A correction extending toward the weekly long-term trend at 5828.5 could raise concerns about a shift in the current balance of power, as holding this trend is crucial for maintaining an advantage. Additional intraday reference points include the classic pivot levels, which are updated daily, with new data emerging at the market open.
***
Technical Analysis Components:
- Higher Timeframes: Ichimoku Kinko Hyo (9.26.52) and Fibonacci Kijun levels
- H1: Classic Pivot Points and 120-period Moving Average (weekly long-term trend)
 English
 Русский
 Bahasa Indonesia
 Bahasa Malay
 ไทย
ไทย Español
 Deutsch
 Български
 Français
 Tiếng Việt
 中文
中文 বাংলা
বাংলা हिन्दी
 Čeština
 Українська
 Română

