 English
  Русский
 Bahasa Indonesia
 Bahasa Malay
 ไทย
ไทย Español
 Deutsch
 Български
 Français
 Tiếng Việt
 中文
中文 বাংলা
বাংলা हिन्दी
 Čeština
 Українська
 Română

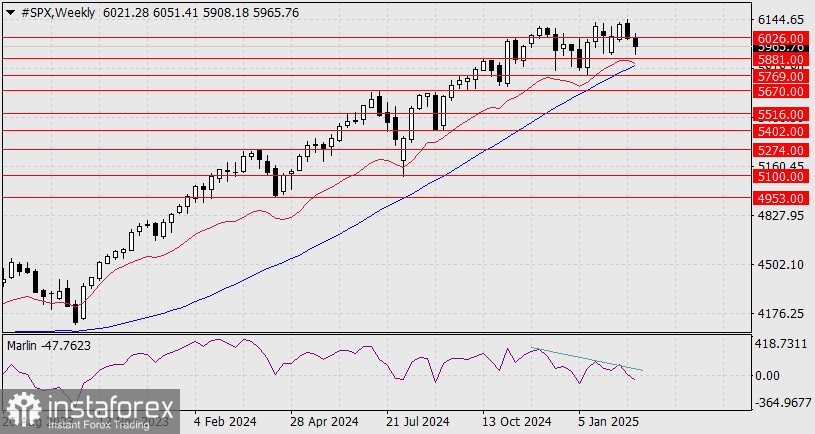
The Marlin oscillator has already moved into negative territory, pulling the price downward. Next week, we may witness an intense battle at the 5881 level, which is reinforced by the MACD line.
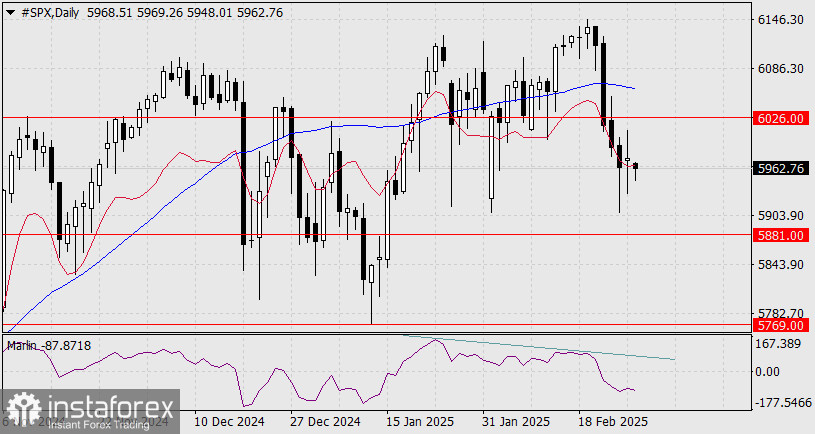
A divergence has also developed on the daily chart. The price is declining below both indicator lines, and the Marlin oscillator is in a downward trend zone. The price is targeting the 5881 level, and a consolidation below this point will open the path to 5769, which is the low from January 13 and the high from September 26 of last year.
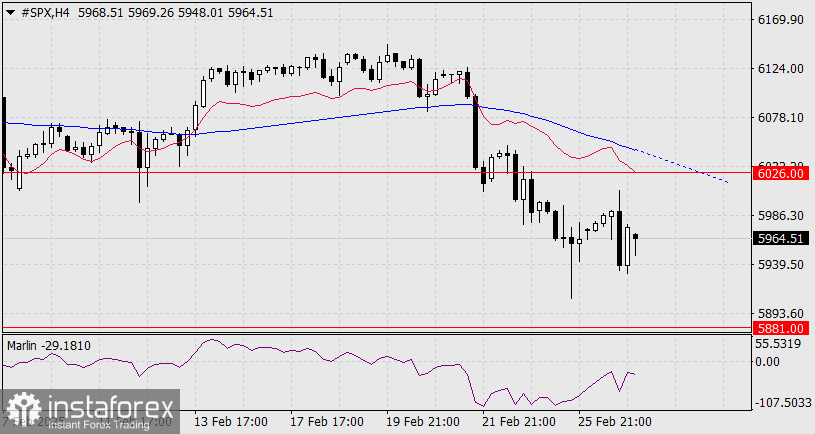
On the four-hour chart, there is a minor additional consideration: before the price breaks downward, a continuation of the correction towards 6026 or slightly lower (to the MACD line) is possible if sideways movement occurs. The Marlin oscillator, which is approaching the neutral zero line, suggests this scenario could serve as the final pause before the battle at the 5881 level.