 English
  Русский
 Bahasa Indonesia
 Bahasa Malay
 ไทย
ไทย Español
 Deutsch
 Български
 Français
 Tiếng Việt
 中文
中文 বাংলা
বাংলা हिन्दी
 Čeština
 Українська
 Română

Trend Analysis (Figure 1)
On Tuesday, the market is expected to rise from 1.2620 (Monday's closing price), aiming for a test of the 1.2689 upper fractal (red dotted line). Upon reaching this level, the price may pull back downward to retest the 1.2677 upper fractal (daily candle from February 21, 2025).
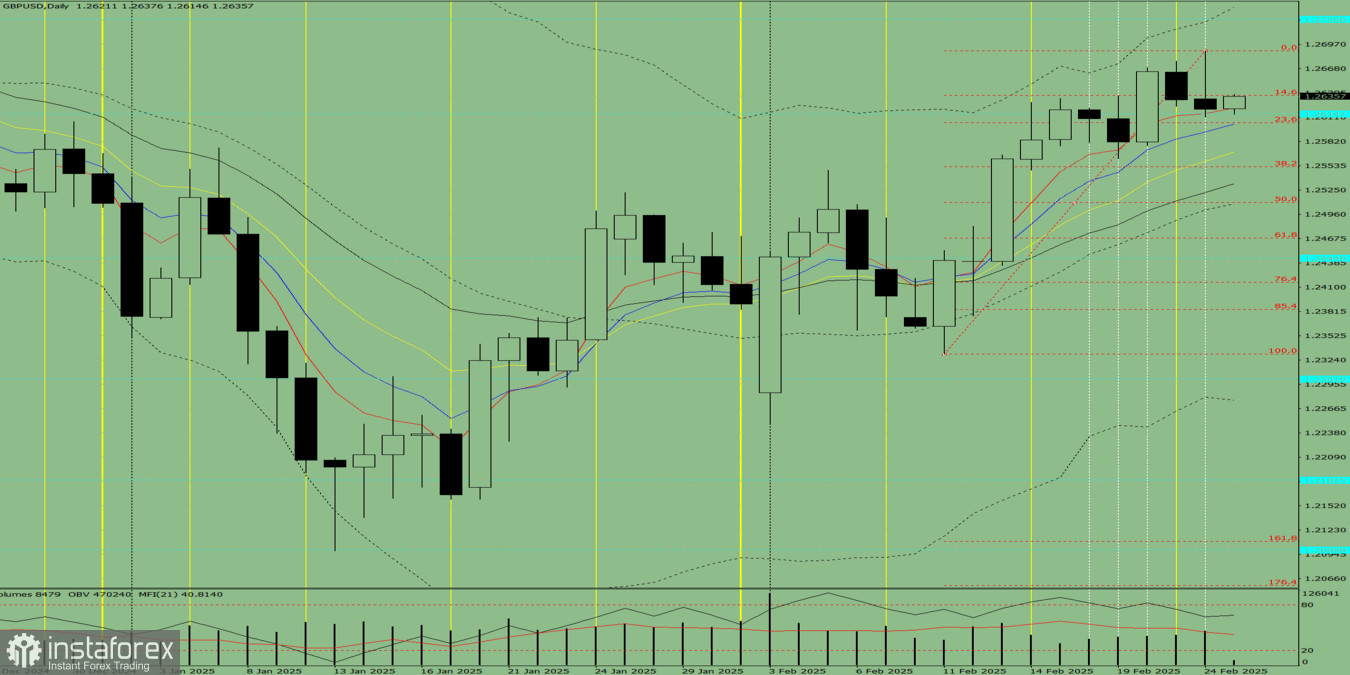
Figure 1: Daily Chart
Comprehensive Analysis:
- Indicator analysis: bullish
- Volume analysis: bullish
- Candlestick analysis: bearish
- Trend analysis: bullish
- Bollinger Bands: bullish
- Weekly chart outlook: bullish
General Conclusion:
The overall trend remains bullish.
Alternative Scenario:
The price may rise from 1.2620, targeting the 1.2689 upper fractal (red dotted line). If this level is tested, the price may continue upward toward the 1.2727 historical resistance level (blue dotted line).