GBP/USD 5-Minute Analysis

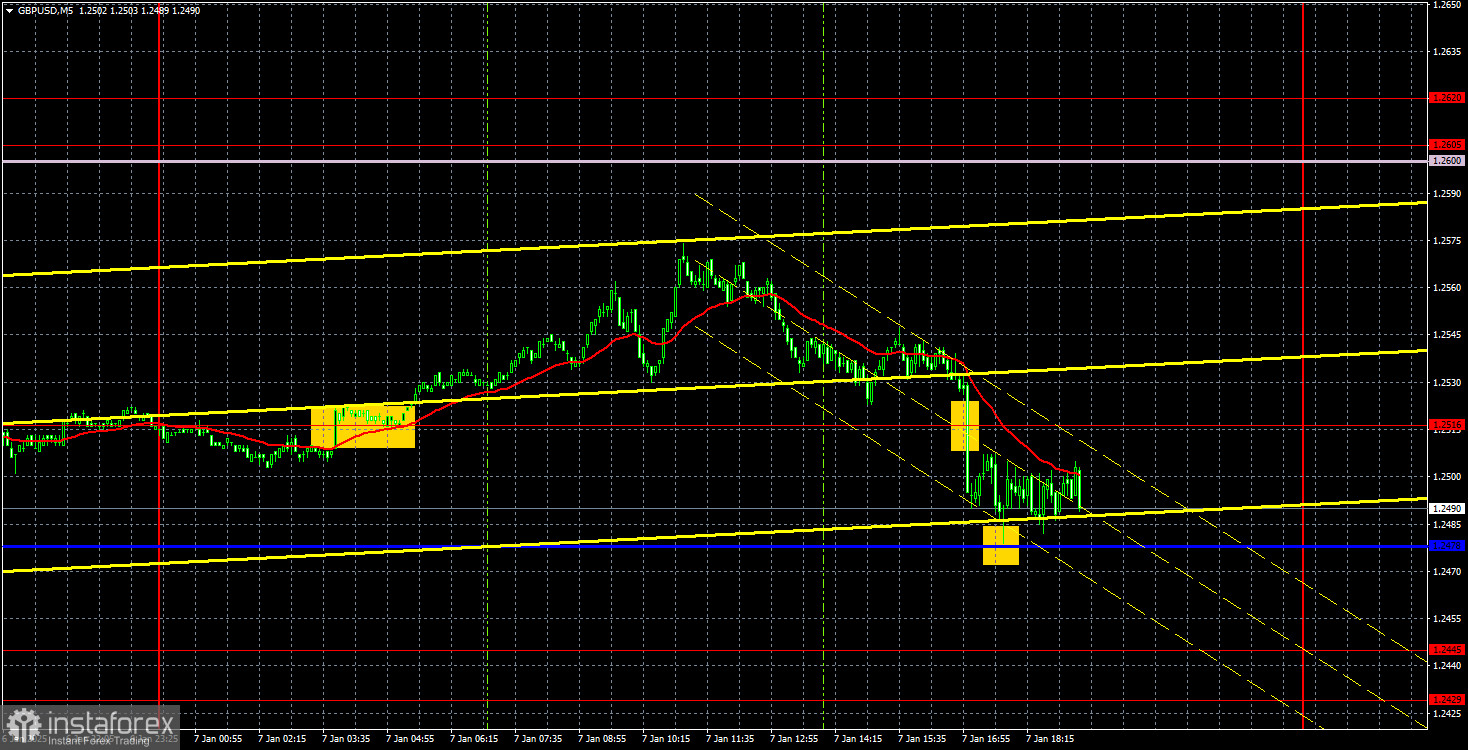
The GBP/USD currency pair tried to maintain its upward momentum on Tuesday but ended up moving in the opposite direction. The British pound had no significant factors supporting its strong growth on Monday, and there were also no drivers for continued gains on Tuesday. As a result, we view the recent upward movement as illogical and inconsistent. It is likely a technical correction. The price was unable to break above the Senkou Span B line, indicating that the downward trend remains intact, and a decline could resume at any time.
In the medium term, the British pound still lacks strong fundamentals to support growth. Analyzing the hourly timeframe makes it challenging to identify clear trading patterns over recent months and years. However, looking at higher timeframes provides a clearer picture. Therefore, it's advisable to begin your analysis with higher timeframes, even if you are trading intraday, to grasp the broader market context. On Wednesday, movements in GBP/USD may be more subdued due to a weak macroeconomic backdrop. The FOMC meeting minutes will be largely formal, while the ADP employment report is of less significance compared to the Non-Farm Payrolls report, which is much more critical for the market.
On Tuesday, the 5-minute chart generated a buy signal near the 1.2516 level. However, the price failed to reach the nearest target, the Senkou Span B line, throughout the day. Profits on this trade could only be realized if closed manually, but there was no loss, as the price moved more than 20 pips in the desired direction. During the U.S. session, a sell signal formed near the 1.2516 level, and the nearest target, the Kijun-sen line, was achieved.
COT Report

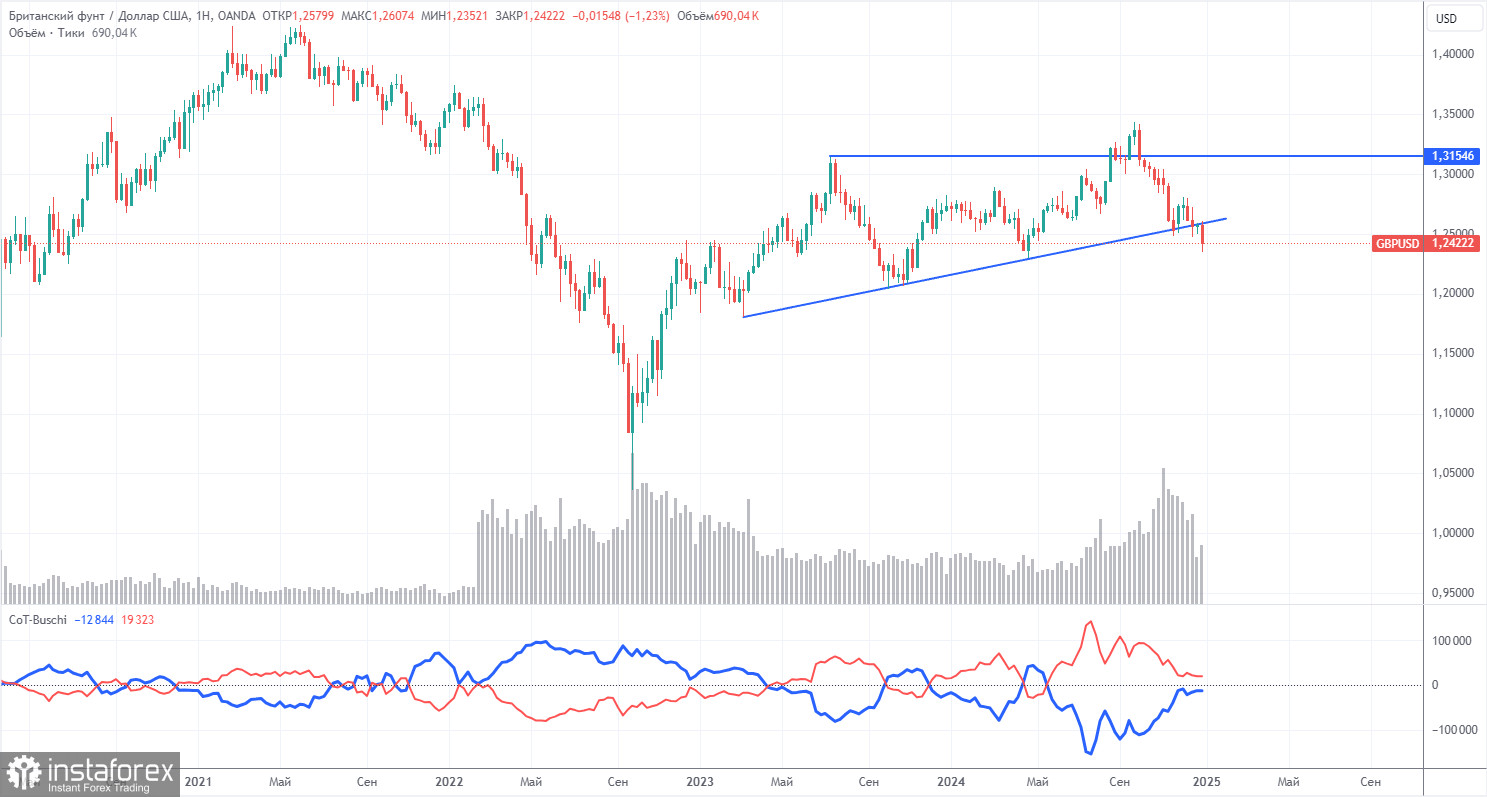
The Commitments of Traders (COT) reports for the British pound indicate that the sentiment of commercial traders has been highly volatile in recent years. The red and blue lines, representing the net positions of commercial and non-commercial traders, frequently intersect and generally hover near the zero mark. On the weekly timeframe, the price initially broke below the 1.3154 level and subsequently moved down to the trendline, which it breached this week. This breach of the trendline strongly suggests that the pound's decline is likely to continue.
According to the latest COT report, the "non-commercial" group closed 3,700 buy contracts and 1,400 sell contracts. As a result, the net position of non-commercial traders decreased by 2,300 contracts over the week.
The current fundamental outlook does not support any long-term purchases of the British pound. The currency seems likely to continue its global downtrend. Consequently, the net position may keep declining, indicating a reduced demand for the pound sterling.
GBP/USD 1-Hour Analysis

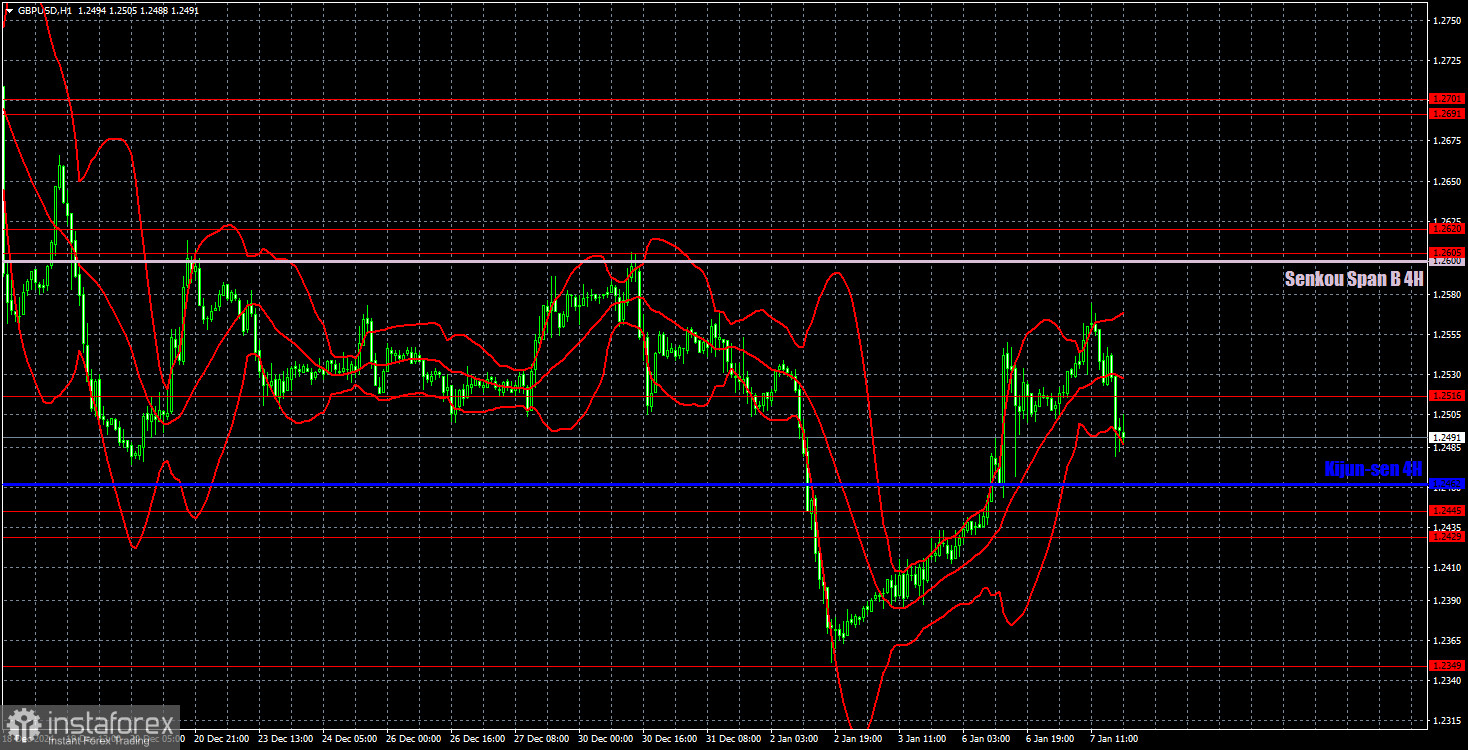
On the hourly timeframe, the GBP/USD pair is generally showing a bearish trend; however, a new wave of corrective movement has begun. We still see no reason for the pound sterling to rally, apart from the technical need for periodic corrections. In the medium term, we continue to expect a decline in the pound. This week, the British currency could quickly fall back to the 1.2349 level if the U.S. labor market and unemployment data are strong.
For January 8, the following key levels are highlighted: 1.2269, 1.2349, 1.2429-1.2445, 1.2516, 1.2605-1.2620, 1.2691-1.2701, 1.2796-1.2816, 1.2863. The Senkou Span B line (1.2600) and the Kijun-sen line (1.2462) can also serve as signal sources. It is recommended to set a Stop Loss to breakeven after the price moves 20 pips in the desired direction. Ichimoku indicator lines may shift during the day, so this should be considered when identifying trading signals.
No significant data is scheduled for release in the UK on Wednesday. The U.S. will release reports that may seem important but are unlikely to have a substantial impact on the market. While the ADP report could provoke some reaction, it is more likely that the market will wait for the Non-Farm Payrolls release. The jobless claims report typically does not attract significant attention, and the FOMC minutes are formal documents that rarely provide new information.
Illustration Explanations:
- Support and Resistance Levels (thick red lines): Thick red lines indicate where movement may come to an end. Please note that these lines are not sources of trading signals.
- Kijun-sen and Senkou Span B Lines: Ichimoku indicator lines transferred from the 4-hour timeframe to the hourly timeframe. These are strong lines.
- Extreme Levels (thin red lines): Thin red lines where the price has previously bounced. These serve as sources of trading signals.
- Yellow Lines: Trendlines, trend channels, or any other technical patterns.
- Indicator 1 on COT Charts: Represents the net position size for each category of traders.
 English
 Русский
 Bahasa Indonesia
 Bahasa Malay
 ไทย
ไทย Español
 Deutsch
 Български
 Français
 Tiếng Việt
 中文
中文 বাংলা
বাংলা हिन्दी
 Čeština
 Українська
 Română

