Analysis of Monday's Trades
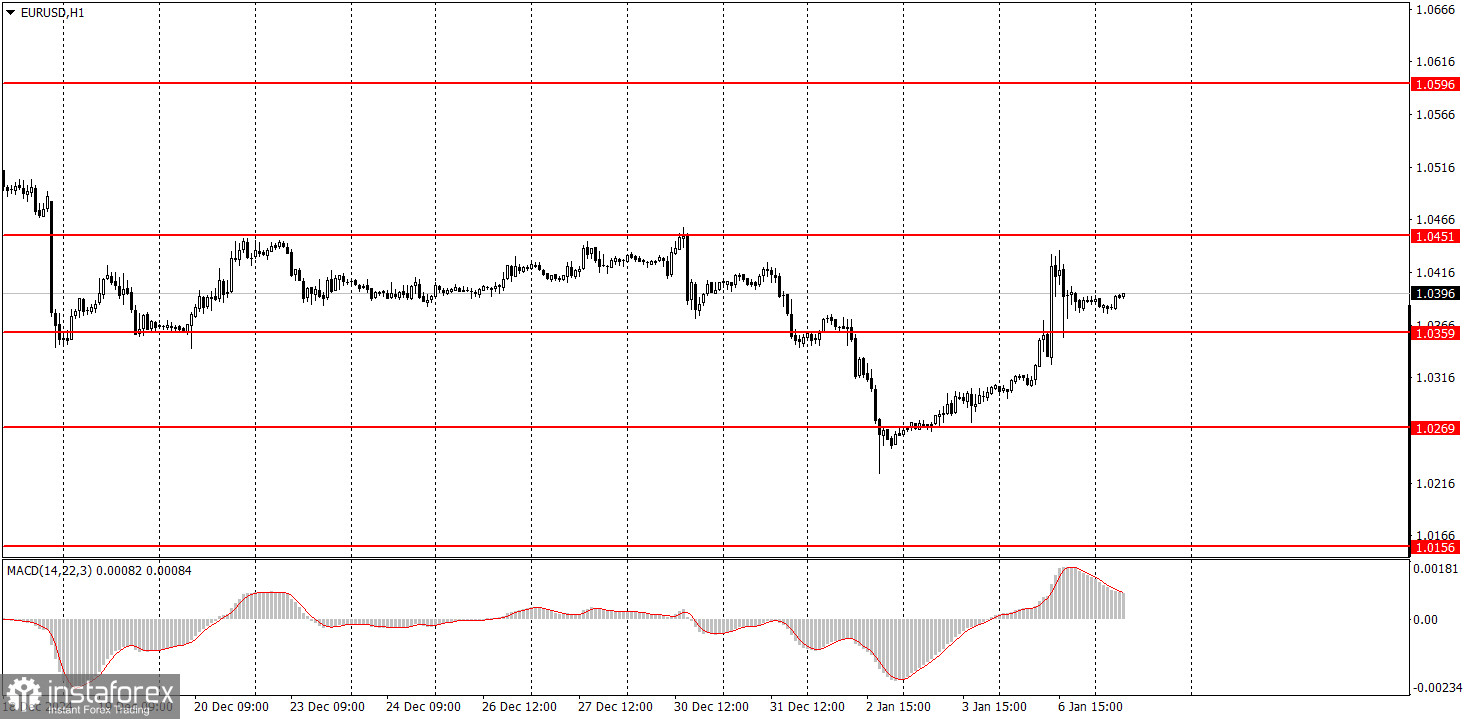
1H Chart of EUR/USD

The EUR/USD currency pair continued its significant growth on Monday, building on the momentum that started on Friday. While Friday's movement could be seen as a typical corrective rebound following Thursday's drop, Monday's activity appears less aligned with the overall market context. As previously noted, the pair's movements over the past three days have lacked clear logic. Specifically, although the market had some justification for buying the euro yesterday, the most important report—Germany's inflation data, which showed stronger-than-expected acceleration—was released only after the euro experienced a sharp surge. This leaves us with two possibilities: either this report did not actually influence the euro's rise, or major market players were aware of its significance in advance, leaving ordinary traders unable to anticipate the movement.
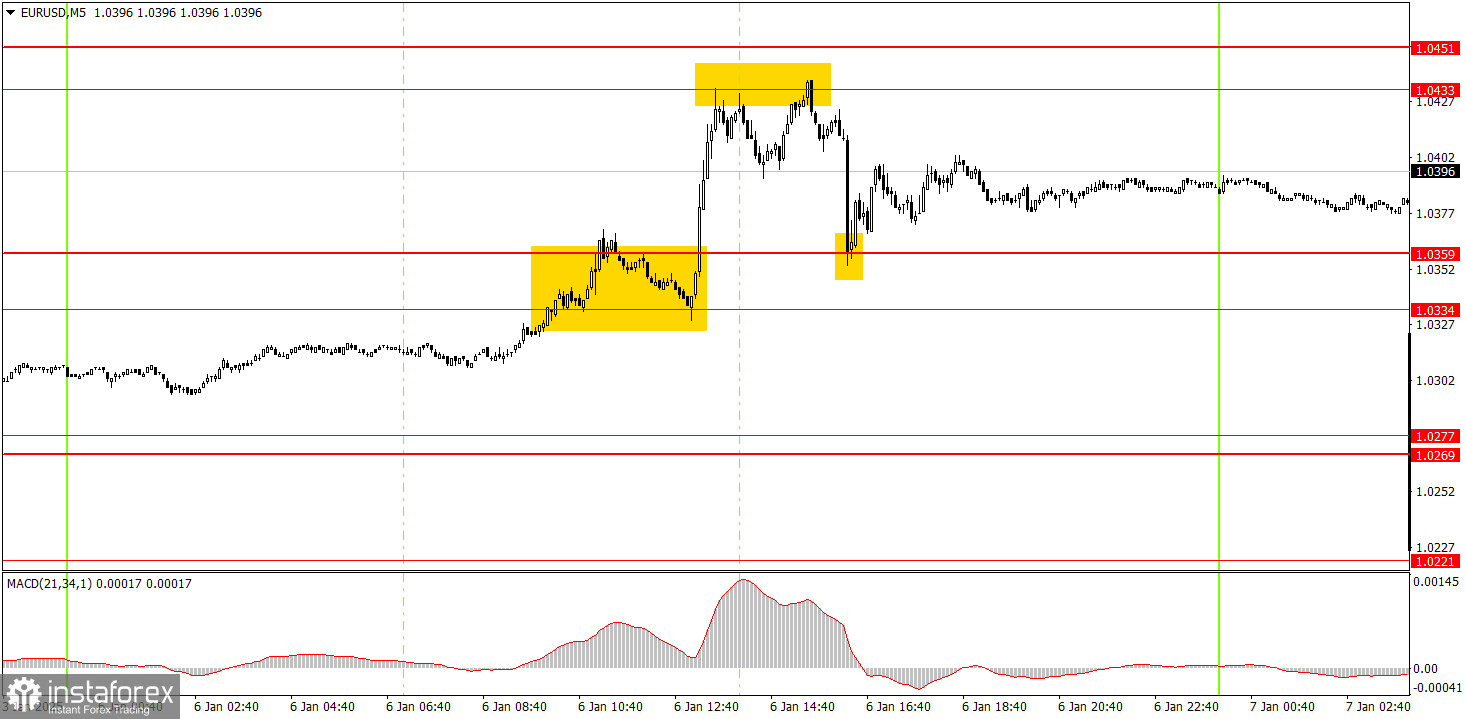
5M Chart of EUR/USD

On the 5-minute timeframe on Monday, the trading signals for the euro were quite strong, reflecting the overall intraday movement. Initially, the range of 1.0334 to 1.0359 was breached, after which the price tested the 1.0433 level and rebounded from it three times. This provided novice traders with opportunities to open long positions initially, followed by short positions. About an hour after the sell signal formed, the price returned to the 1.0359 level and rebounded again. This allowed for the opening of a third position—this time long. As a result, all three trades closed with a profit.
Trading Strategy for Tuesday:
In the hourly timeframe, the EUR/USD pair has emerged from its "holiday flat" phase, initially experiencing a decline followed by a sharp recovery. We anticipate that the euro's decline will resume in the medium term, with parity not being far off. The fundamental and macroeconomic environment continues to favor the U.S. dollar, indicating further potential for the euro to fall.
On Tuesday, the pair may attempt to test the 1.0451 level, now that a new correction has begun. If the price consolidates above this level, the correction could extend for a longer duration.
On the 5-minute timeframe, the following levels should be considered: 1.0156, 1.0221, 1.0269-1.0277, 1.0334-1.0359, 1.0433-1.0451, 1.0526, 1.0596, 1.0678, 1.0726-1.0733, 1.0797-1.0804, 1.0845-1.0851. On Tuesday, the Eurozone will release unemployment and inflation reports, with the inflation report being of primary importance. Meanwhile, the U.S. will also publish significant data, including the ISM Services PMI and JOLTs Job Openings.
Core Trading System Rules:
- Signal Strength: The shorter the time it takes for a signal to form (a rebound or breakout), the stronger the signal.
- False Signals: If two or more trades near a level result in false signals, subsequent signals from that level should be ignored.
- Flat Markets: In flat conditions, pairs may generate many false signals or none at all. It's better to stop trading at the first signs of a flat market.
- Trading Hours: Open trades between the start of the European session and the middle of the US session, then manually close all trades.
- MACD Signals: On the hourly timeframe, trade MACD signals only during periods of good volatility and a clear trend confirmed by trendlines or trend channels.
- Close Levels: If two levels are too close (5–20 pips apart), treat them as a support or resistance zone.
- Stop Loss: Set a Stop Loss to breakeven after the price moves 15 pips in the desired direction.
Key Chart Elements:
Support and Resistance Levels: These are target levels for opening or closing positions and can also serve as points for placing Take Profit orders.
Red Lines: Channels or trendlines indicating the current trend and the preferred direction for trading.
MACD Indicator (14,22,3): A histogram and signal line used as a supplementary source of trading signals.
Important Events and Reports: Found in the economic calendar, these can heavily influence price movements. Exercise caution or exit the market during their release to avoid sharp reversals.
Forex trading beginners should remember that not every trade will be profitable. Developing a clear strategy and practicing proper money management are essential for long-term trading success.
 English
 Русский
 Bahasa Indonesia
 Bahasa Malay
 ไทย
ไทย Español
 Deutsch
 Български
 Français
 Tiếng Việt
 中文
中文 বাংলা
বাংলা हिन्दी
 Čeština
 Українська
 Română

