Monday Trade Analysis:
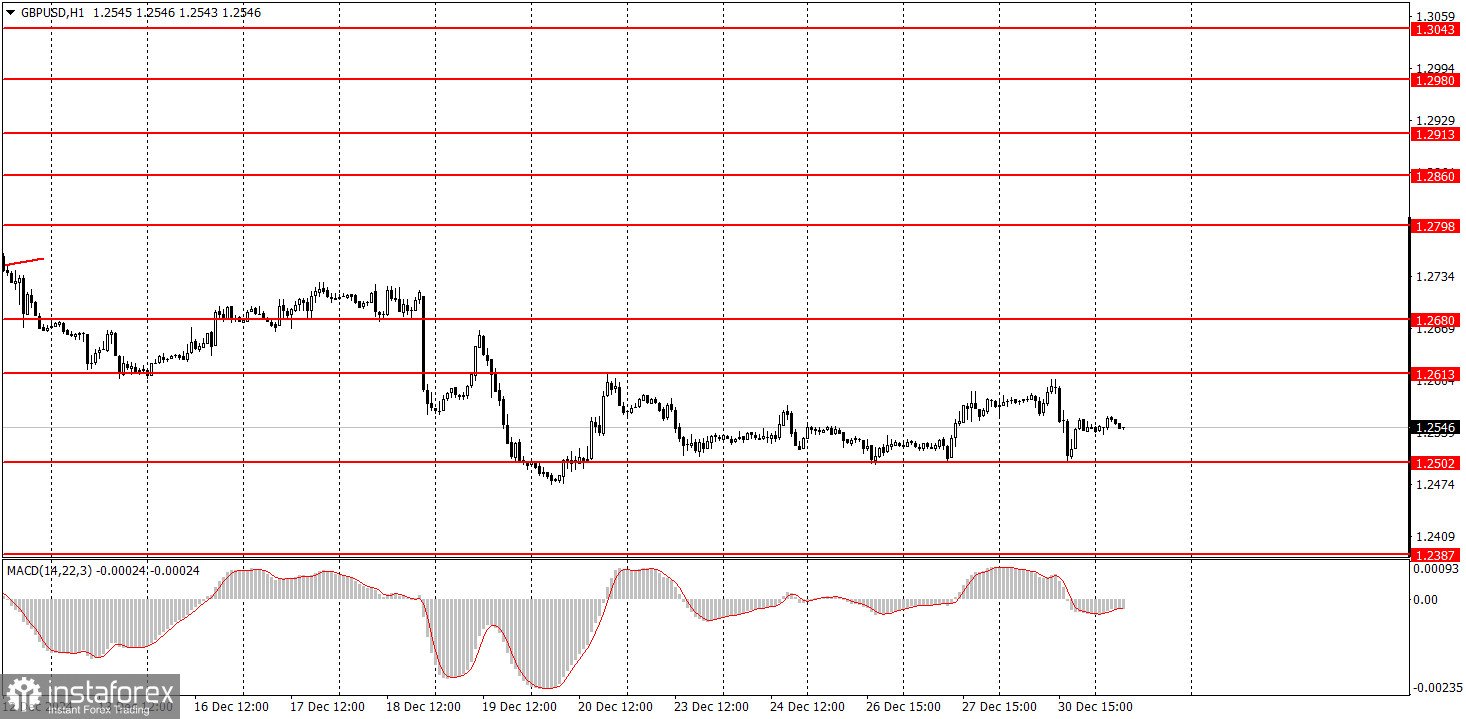
1H Chart of the GBP/USD Pair:

On Monday, the GBP/USD pair continued trading within a flat channel. The pound has its own sideways range bounded by the levels of 1.2502 and 1.2613, which closely resembles the euro's sideways channel of about 100 points. Yesterday, the pair reached the upper boundary of the sideways range, but no clear rebound was observed. Nevertheless, the pair reversed and worked its way down to the lower boundary during the day. This was a typical movement within a sideways range. There was no fundamental or macroeconomic background to influence the market. Tuesday will also be a shortened trading day.
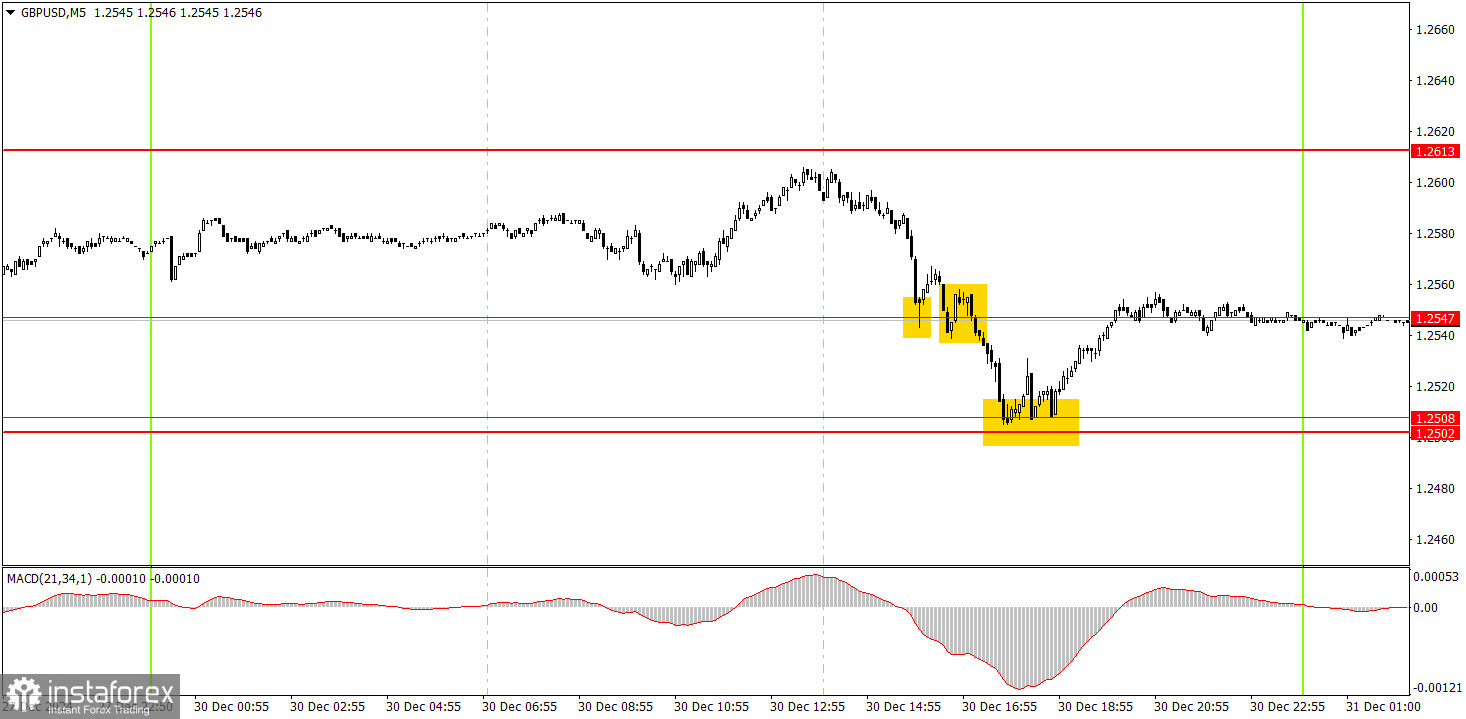
5M Chart of the GBP/USD Pair:

On the 5-minute timeframe on Monday, two trading signals were formed. Unfortunately, the price came just a few points short of reaching the 1.2613 level to form a sell signal near the upper boundary of the flat range. If this signal had formed, entering the market would have been more appealing. Instead, signals formed near the levels of 1.2547 and 1.2508, two of which were profitable. As a result, there could be no losses on Monday, though profits could have been much higher if not for a few "buts."
How to Trade on Tuesday:
On the hourly timeframe, the GBP/USD pair has completed the main leg of its upward correction and is now flat. In the medium term, we fully support the pound's decline, as we believe this is the only logical outcome. However, it's worth remembering that the British pound has significant resistance against the US dollar. Thus, only a decline should be expected, but technical signals should guide trades. The outcomes of the Bank of England and Federal Reserve meetings fully support the continuation of a southern trajectory.
On Tuesday, the GBP/USD pair might trade completely randomly or continue within the same flat channel with low volatility.
On the 5-minute timeframe, trades can be executed based on the levels of 1.2387, 1.2445, 1.2502–1.2508, 1.2547, 1.2633, 1.2680–1.2685, 1.2723, 1.2791–1.2798, 1.2848–1.2860, 1.2913, and 1.2980–1.2993. No noteworthy events are scheduled in the UK or the US on Tuesday that could influence trader sentiment or push the pair out of its flat range.
Main Rules of the Trading System:
- The strength of a signal is determined by the time taken to form the signal (rebound or breakthrough of a level). The shorter the time, the stronger the signal.
- If two or more trades at a level produce false signals, all subsequent signals from that level should be ignored.
- In a flat market, any pair can generate numerous false signals or none at all. In any case, trading should stop at the first signs of a flat market.
- Trades should be opened during the European session and closed manually by the middle of the American session.
- On the hourly timeframe, MACD signals should only be traded with good volatility and a trend confirmed by a trendline or trend channel.
- If two levels are very close to each other (5 to 20 points apart), they should be treated as a support or resistance area.
- After a trade moves 20 points in the right direction, set a Stop Loss to break even.
What's on the Charts:
- Support and Resistance Levels: Target levels for opening buy or sell trades, where Take Profit levels can also be set.
- Red Lines: Channels or trendlines that display the current trend and indicate the preferred trading direction.
- MACD Indicator (14, 22, 3): The histogram and signal line serve as an auxiliary source of trading signals.
- Important Reports and Speeches: Found in the news calendar, these can significantly impact currency pair movements. It is recommended to trade cautiously or exit the market during such events to avoid sharp reversals.
Note for Beginners: Not every trade can be profitable. Developing a clear strategy and applying money management principles are the keys to long-term success in trading.
 English
 Русский
 Bahasa Indonesia
 Bahasa Malay
 ไทย
ไทย Español
 Deutsch
 Български
 Français
 Tiếng Việt
 中文
中文 বাংলা
বাংলা हिन्दी
 Čeština
 Українська
 Română

