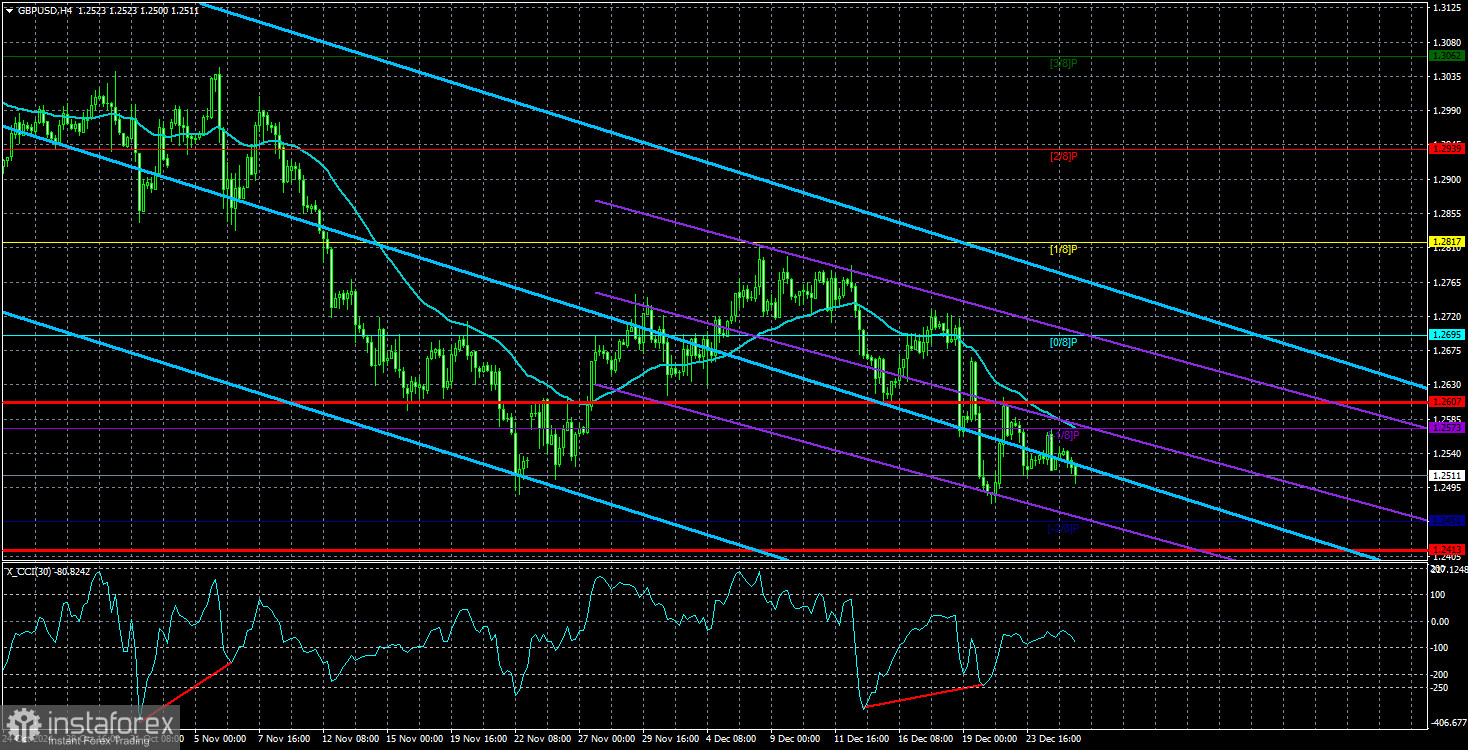
The GBP/USD currency pair experienced low trading activity on Thursday, remaining largely stagnant. There was a slight downward trend, but it was hardly significant. Analyzing the 4-hour timeframe reveals a clear technical picture: the price has been in decline for over two months, followed by a weak correction, and has subsequently returned to its recent low of 1.2490. Upon reaching this level, the pair did bounce back slightly, but this rebound was notably weaker than before. Currently, even with the holiday, the pair seems to be approaching this level again, and we believe it is likely to be breached soon. As we've mentioned before, the pound is expected to weaken further, and this trend is increasingly evident.
On higher timeframes, the situation is even more revealing. Yesterday, we analyzed the weekly chart, where everything is crystal clear. The pound could continue to decline for an extended period. Of course, with Donald Trump's return to the presidency, the global landscape could shift significantly. Over the past five years, the world has faced an unprecedented number of crises and upheavals, making long-term forecasts difficult and unappealing. For now, however, the fundamental backdrop remains unchanged.
Even the recent "bullish divergence" holds little real significance. While it did trigger a small corrective phase, in a downward trend, bullish divergences typically indicate corrections rather than trend reversals. The fundamentals continue to weigh heavily on the pound, which has experienced two years of growth primarily driven by "thin air."
The strategy for GBP/USD is currently quite straightforward. With no macroeconomic factors to consider, trading is entirely technical. Since all indicators point downward, selling remains the only viable option as long as the price stays below the moving average.
Alternatively, traders can wait for the new year to approach the market with a clearer strategy. However, this approach won't fundamentally change the situation. The underlying fundamentals will remain the same at the start of 2025, with the only difference being slightly stronger movements as the holiday season concludes.
It's also important to remember the nearly six months of low volatility during the first half of 2024. Low volatility and flat trading are not anomalies; they are perfectly normal occurrences that are often unrelated to holiday periods.

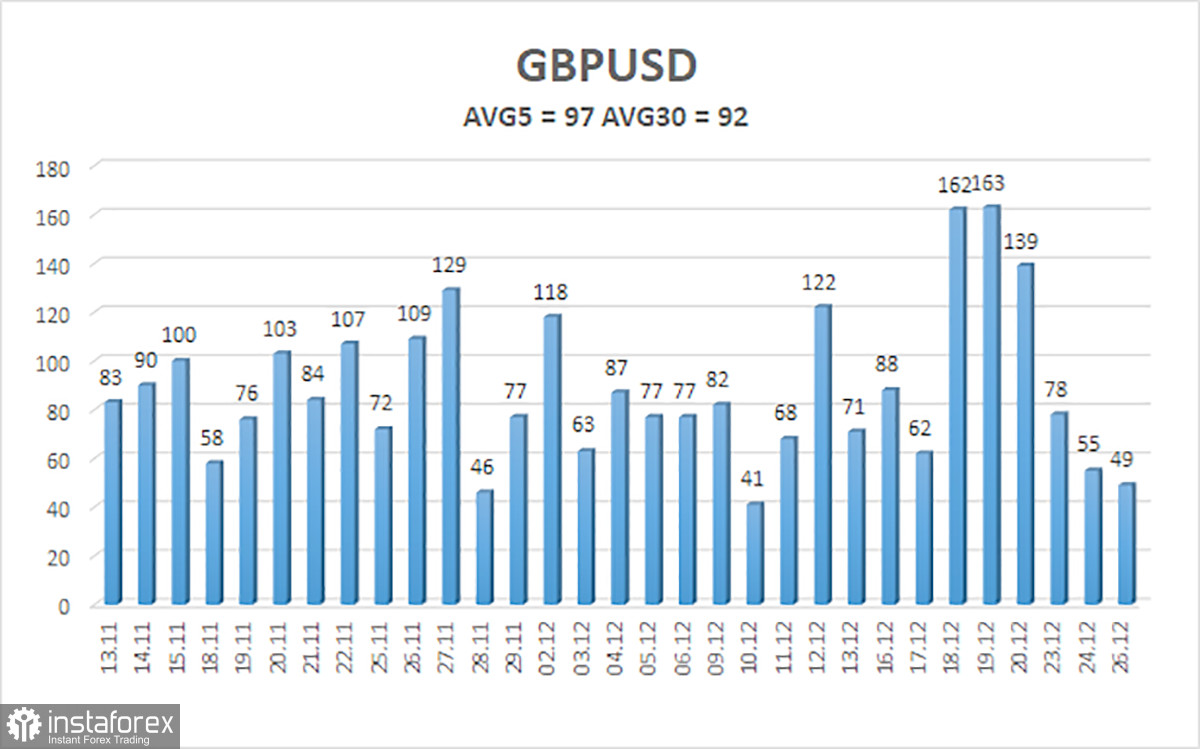
The average volatility of the GBP/USD currency pair over the last five trading days is 97 pips, which is classified as "moderate" for this pair. On Friday, December 27, we expect the pair to trade within the range of 1.2413 to 1.2607. The upper linear regression channel is tilted downward, indicating a prevailing bearish trend. The CCI indicator has recently entered oversold territory again, suggesting that the pound is poised to continue its downward trend, as we have emphasized before. Any oversold conditions during a downtrend typically indicate only a correction. The CCI's bullish divergence also points to a possible correction, which may already be complete.
Nearest Support Levels:
- S1 – 1.2451
Nearest Resistance Levels:
- R1 – 1.2573
- R2 – 1.2695
- R3 – 1.2817
Trading Recommendations:
Although the GBP/USD currency pair maintains a bearish trend, it continues to correct. We believe that long positions are not advisable at this time, as the market has likely already factored in all potential drivers for the pound's growth. If you are trading based solely on technical analysis, long positions could be considered with a target of 1.2817, but only if the price moves above the moving average line. In contrast, short positions are much more relevant right now, with targets set at 1.2451 and 1.2413.
Explanation of Illustrations:
Linear Regression Channels help determine the current trend. If both channels are aligned, it indicates a strong trend.
Moving Average Line (settings: 20,0, smoothed) defines the short-term trend and guides the trading direction.
Murray Levels act as target levels for movements and corrections.
Volatility Levels (red lines) represent the likely price range for the pair over the next 24 hours based on current volatility readings.
CCI Indicator: If it enters the oversold region (below -250) or overbought region (above +250), it signals an impending trend reversal in the opposite direction.
 English
 Русский
 Bahasa Indonesia
 Bahasa Malay
 ไทย
ไทย Español
 Deutsch
 Български
 Français
 Tiếng Việt
 中文
中文 বাংলা
বাংলা हिन्दी
 Čeština
 Українська
 Română

