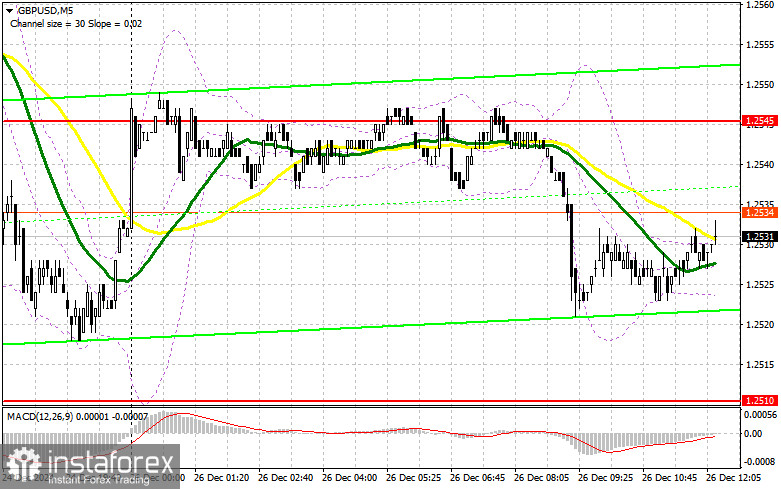
In my morning forecast, I highlighted the 1.2510 level as a key decision point for market entry. Let's analyze the 5-minute chart to see what happened. While the pair declined, it did not reach the 1.2510 level, so I had no trades in the first half of the day. The technical picture remains unchanged for the second half of the day.

To Open Long Positions on GBP/USD:
The market stagnation is directly tied to the lack of UK statistics. It's likely that the same situation—low-volatility channel trading—will persist in the second half of the day, as there is nothing of note except for the U.S. weekly labor market data. Typically, this indicator doesn't significantly influence market sentiment unless the figures deviate substantially from economists' forecasts.
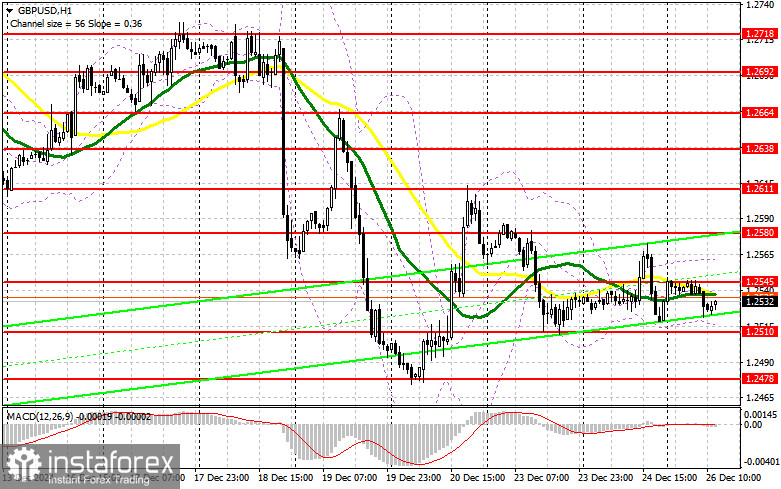
If the pair declines, only a false breakout around 1.2510, the support formed last week, will provide a good entry point for buying, aiming for a recovery toward the 1.2545 resistance. A breakout and retest above this range will lead to a new entry point for long positions with the prospect of testing 1.2580, where buyers will likely face resistance. The furthest target will be around 1.2611, where I plan to take profits, though it is unlikely that the market will reach this level given current conditions. If GBP/USD falls and bulls fail to show activity at 1.2510, buyers will lose all initiative. In this case, only a false breakout around 1.2478, last week's low, will justify opening long positions. Long positions on a rebound are possible from 1.2424, targeting a 30–35-point intraday correction.
To Open Short Positions on GBP/USD:
Pound sellers are also not in a hurry to act, which is affecting volume and market volatility. If the pair rises, bears will have to defend the 1.2545 level, where moving averages supporting sellers are located. A false breakout and active protection of 1.2545 will justify building short positions, aiming for a continuation of the downtrend. The target will be the 1.2510 level, which the pair hasn't tested yet today. A breakout and retest below this range will lead to stop-loss orders being triggered, opening the way to 1.2478, dealing a serious blow to bullish positions. The furthest target will be around 1.2424, where I plan to take profits.
If demand for the pound returns in the second half of the day and bears fail to act around 1.2545, buyers will gain a chance for another wave of growth. Bears will then have to retreat to the 1.2580 resistance level. I will only sell there after a false breakout. Short positions on a rebound are planned from 1.2611, targeting a 30–35-point downward correction.

COT Report (Commitments of Traders):
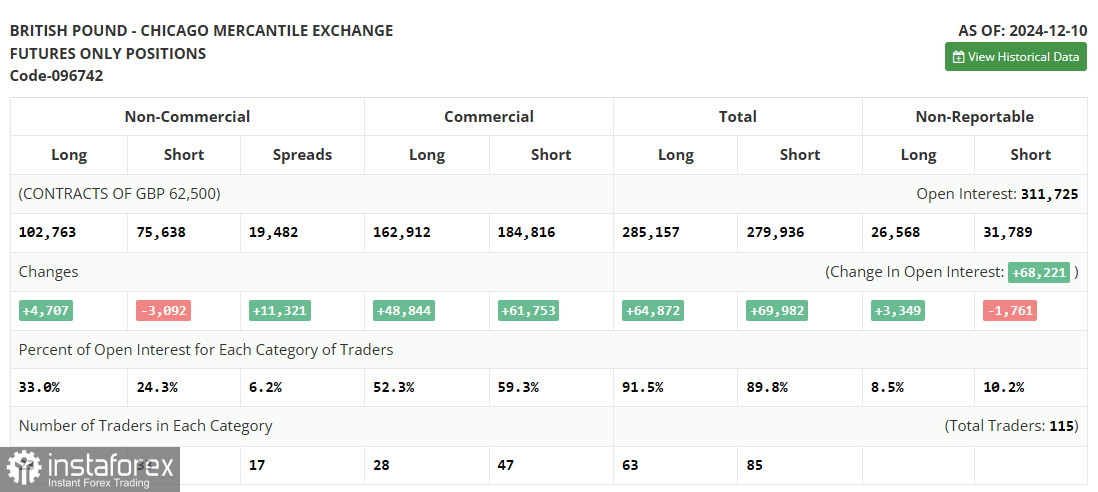
The December 10 report showed a decrease in short positions and an increase in long ones. However, the overall balance of power in the market remains unchanged, as many traders adopted a wait-and-see approach ahead of the Bank of England's final meeting of the year. Non-commercial long positions increased by 4,707 to 102,763, while short positions decreased by 3,092 to 75,638. The gap between long and short positions widened by 11,321.

Indicator Signals:
Moving Averages:
The pair is trading near the 30- and 50-day moving averages, indicating market uncertainty.
Note: Moving averages are based on the H1 hourly chart and differ from the classic daily moving averages on the D1 chart.
Bollinger Bands:
If the pair declines, the lower boundary of the indicator near 1.2510 will act as support.
Indicator Descriptions:
- Moving Average (MA): Determines the current trend by smoothing out volatility and noise.
- 50-period MA: Yellow line on the chart.
- 30-period MA: Green line on the chart.
- MACD Indicator: Moving Average Convergence/Divergence with fast EMA – period 12, slow EMA – period 26, and SMA – period 9.
- Bollinger Bands: Period – 20.
- Non-commercial Traders: Speculators such as individual traders, hedge funds, and large institutions using the futures market for speculative purposes.
- Long Non-commercial Positions: Total long open positions of non-commercial traders.
- Short Non-commercial Positions: Total short open positions of non-commercial traders.
- Net Non-commercial Position: The difference between long and short positions of non-commercial traders.
 English
 Русский
 Bahasa Indonesia
 Bahasa Malay
 ไทย
ไทย Español
 Deutsch
 Български
 Français
 Tiếng Việt
 中文
中文 বাংলা
বাংলা हिन्दी
 Čeština
 Українська
 Română

