Analysis of Macroeconomic Reports:

A fair number of macroeconomic events are scheduled for Friday, but none are significant. A retail sales report in the UK will be released, which is not particularly critical, especially following the Bank of England's policy meeting. Reports on personal incomes and expenditures in the US will be published in the PCE indices and the University of Michigan consumer confidence index. The latter two indices hold relatively higher priority on Friday, though they are still not crucial.
Analysis of Fundamental Events:

No noteworthy fundamental events are expected on Friday. However, the market doesn't require additional speeches or comments from central bank representatives regarding monetary policy. All three major central bank meetings have taken place, and market participants have received comprehensive information about the state of the respective economies and the likely future actions of the central banks. We believe all three meetings conveyed a consistent message to traders: the US dollar will continue strengthening.
General Conclusions:
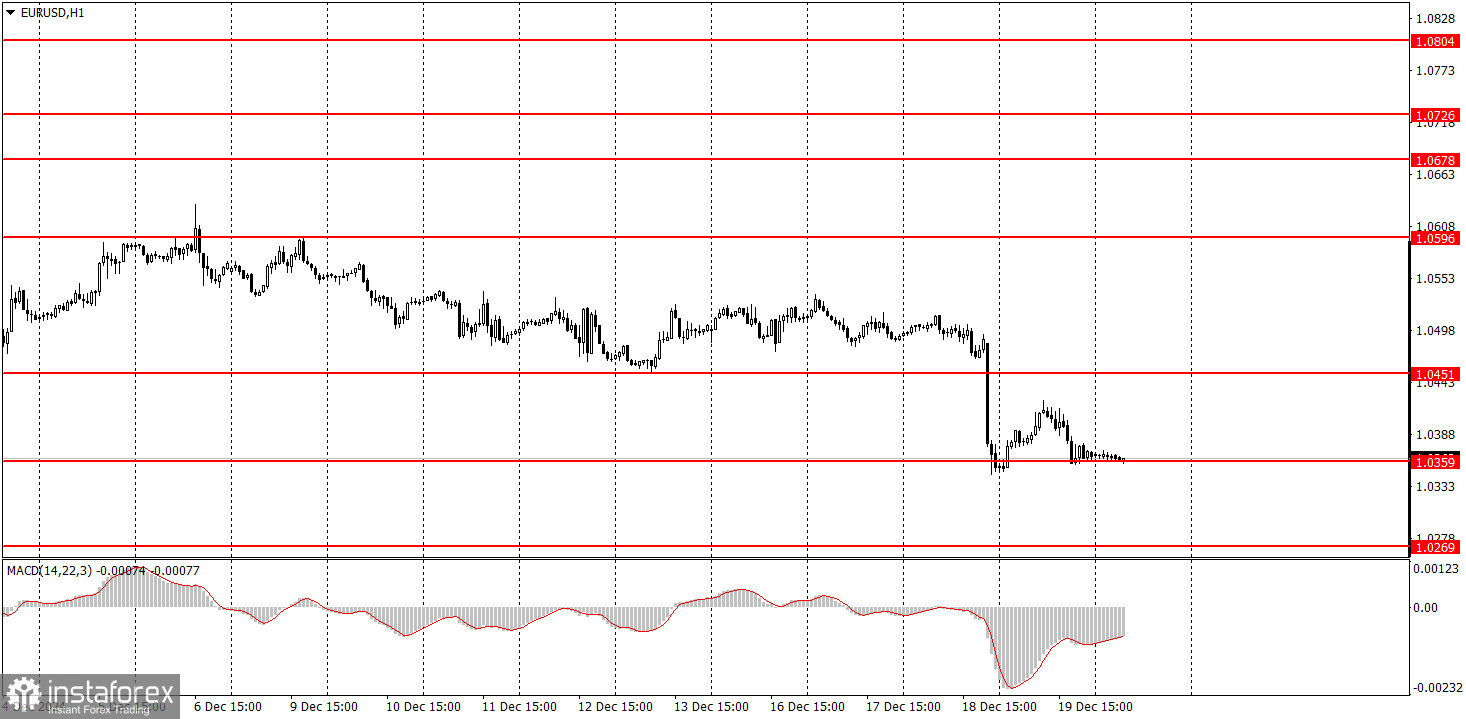
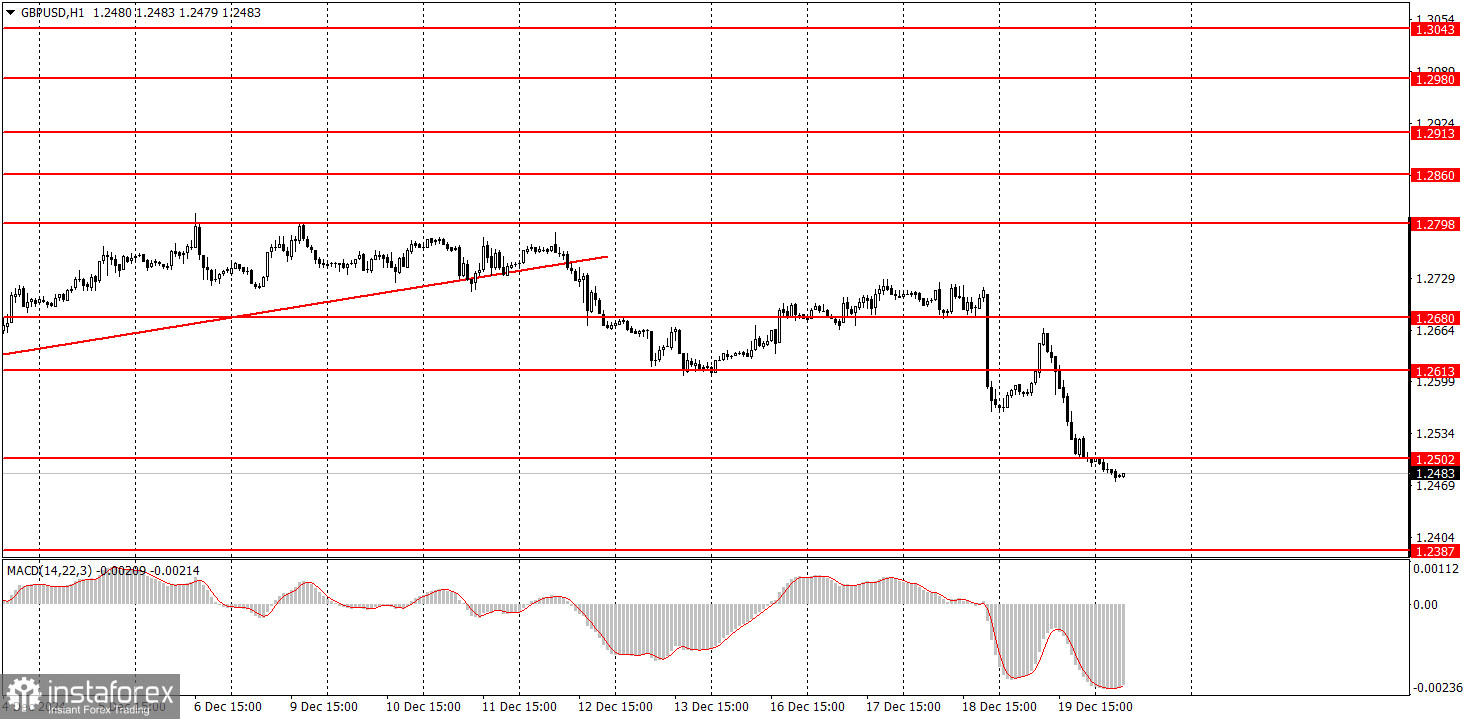
The market could enter a flat phase, a correction, or continue its downward movement on the last trading day of the week. It is essential to rely on trading signals today while keeping in mind that the downward trends in both currency pairs remain intact.
Key Rules for the Trading System:
- Signal strength is determined by the time it takes for a signal to form (bounce or breakout of a level). The shorter the time, the stronger the signal.
- If two or more false signals are generated near a level, subsequent signals from that level should be ignored.
- In a flat market, any pair may produce numerous false signals or none at all. In such cases, it's better to stop trading at the first signs of consolidation.
- Trades should be opened during the European session through the middle of the American session. All trades should be manually closed thereafter.
- On the hourly timeframe, trades based on MACD signals should only be executed during periods of strong volatility and trends confirmed by trendlines or trend channels.
- If two levels are very close (5–20 pips apart), they should be treated as a support or resistance zone.
- After a 15–20 pip movement in the correct direction, set a Stop Loss at breakeven.
What's on the Charts:
Support and Resistance Levels: Targets for opening buy or sell orders. These are ideal points for setting Take Profit levels.
Red Lines: Trendlines or channels reflecting the current trend direction and indicating the preferred trading direction.
MACD Indicator (14,22,3): A histogram and signal line serving as auxiliary indicators and sources of signals.
Key News Events and Reports: Always listed in the economic calendar, these can significantly impact currency pair movements. Exercise caution or exit the market during such events to avoid sharp price reversals.
Every trade cannot be profitable. The key to long-term success in Forex trading lies in developing a clear strategy and effective money management.
 English
 Русский
 Bahasa Indonesia
 Bahasa Malay
 ไทย
ไทย Español
 Deutsch
 Български
 Français
 Tiếng Việt
 中文
中文 বাংলা
বাংলা हिन्दी
 Čeština
 Українська
 Română

