On Wednesday, the GBP/USD currency pair had every chance to show an interesting, trend-driven intraday movement. However, nothing of the sort happened. Yesterday, the UK released one of the most important reports for the British pound—the inflation report. It was published roughly a day before the Bank of England's final meeting of the year. The outcome of this report was expected to influence the British central bank's decision heavily. However, the data was so lackluster that it failed to elicit any reaction from the market. Of course, the price initially dropped by about 35 pips after the release, only to recover the same amount within the next couple of hours. In essence, nothing changed for the pound.
The Consumer Price Index (CPI) rose to 2.6% year-on-year, as forecasted. The core CPI was 3.5% for November, slightly below the 3.6% estimate. Theoretically, only core inflation could have influenced market sentiment, but it didn't. Why? The question remains unanswered. Both figures were indeed "lackluster," but consider how, over the past year or so, the market reacted to even the slightest deviations in U.S. inflation! A deviation of 0.1% could trigger movements larger than those seen after an FOMC meeting! As always, it depends more on the market than the numbers or reports.
What does this mean? Simply, market activity is falling. In our EUR/USD analysis, we already speculated that trading for 2024 might effectively be over. While volatility spikes are possible in thin markets—along with some movements—the market is now entering a phase of emotional instability. Essentially, this means the market will stagnate or overreact to routine news simply because there are few participants. It seems likely that the British pound will face a similar situation in the remaining two weeks.
This scenario doesn't surprise us. First, the holiday season isn't ideal for trading in the currency markets. Second, the GBP/USD pair began its corrective phase three weeks ago. Corrections can take much time, and we've warned about this repeatedly. Thus, it will be a normal development if the pound trades sideways or has a slight upward bias for the next few weeks.
The global downtrend remains intact. The broader fundamental backdrop hasn't changed either. The pound sterling is still afloat only because the Bank of England is in no rush to cut the key rate. Today, the BoE might again support the pound, but only if the number of Monetary Policy Committee officials voting in favor of a rate cut is less than one—a scenario that seems hard to believe.

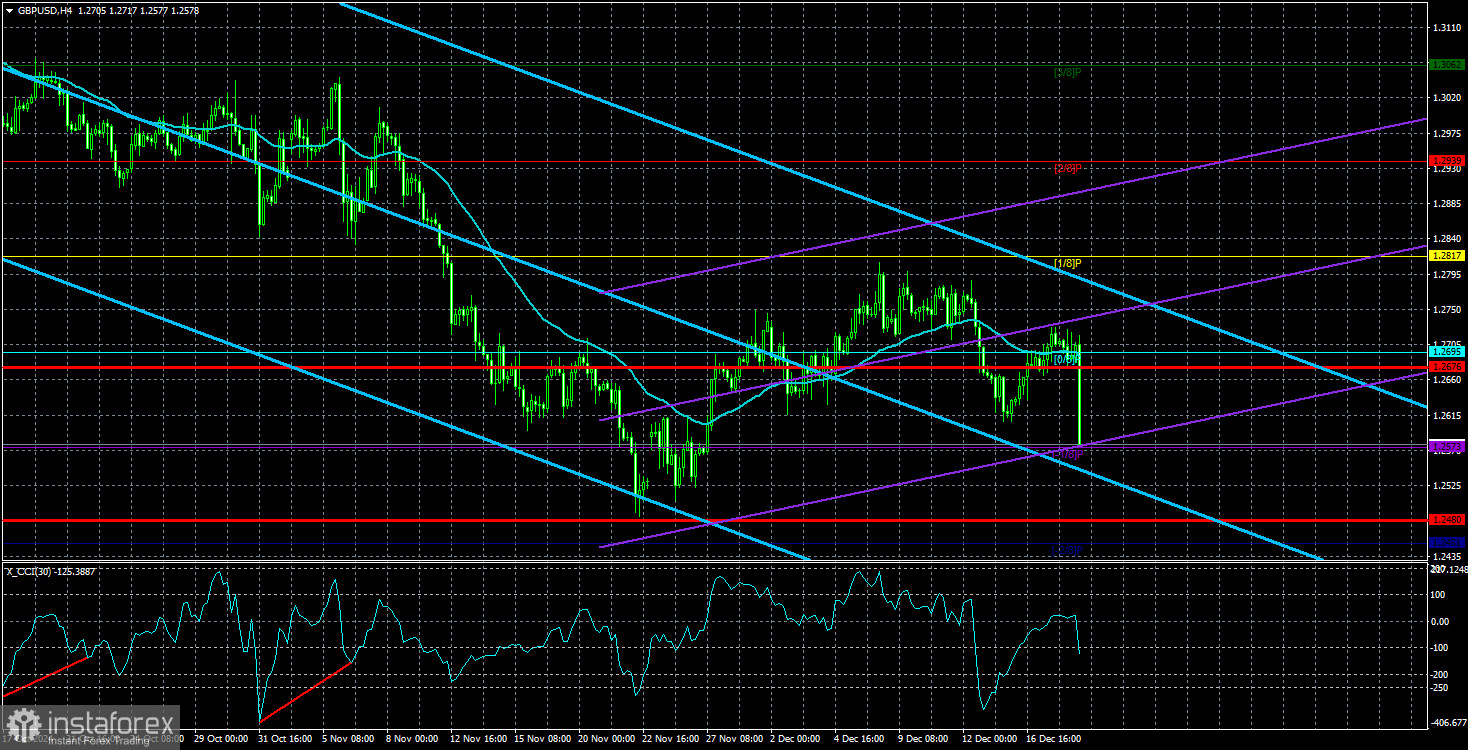
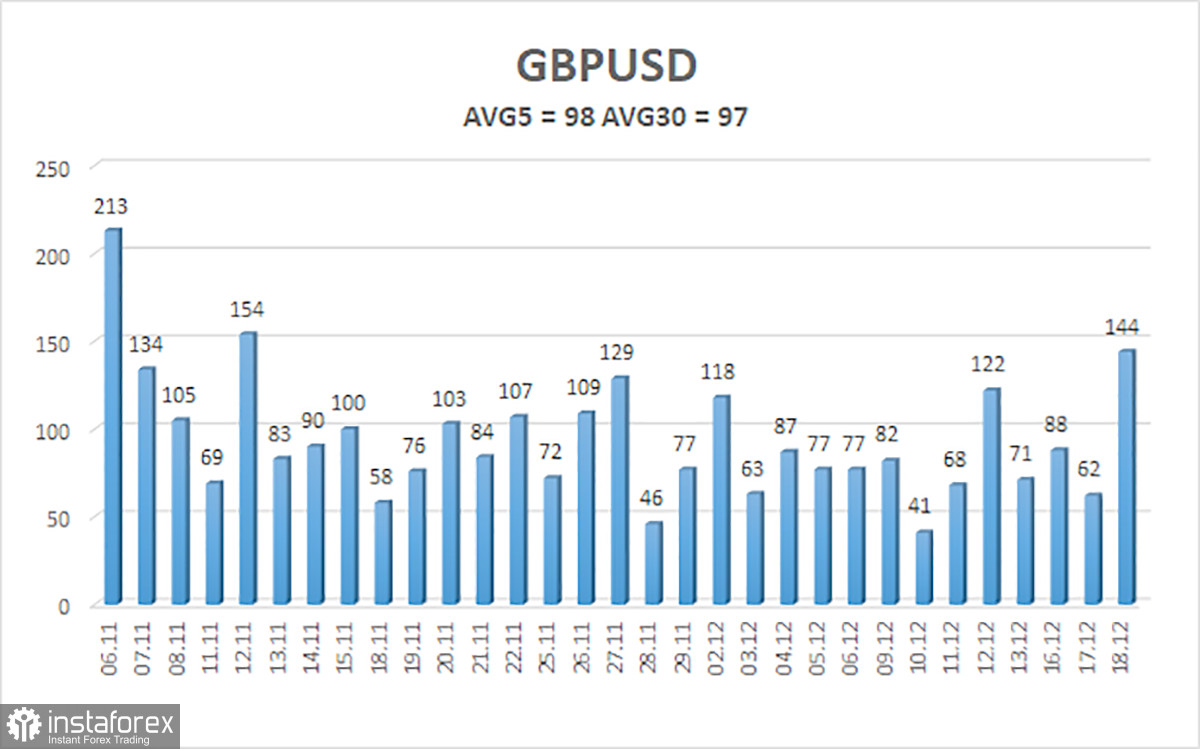
The average volatility of the GBP/USD pair over the last five trading days is 98 pips, considered "average" for the pound/dollar pair. On Thursday, December 19, we expect movement within the range limited by the levels of 1.2480 and 1.2676. The higher linear regression channel is pointing downward, indicating a bearish trend. The CCI indicator recently dipped into the oversold area again, but as we have repeatedly warned, the pound ultimately aims to resume its downward trend. Any oversold signal in a bearish trend is merely a signal for correction.
Nearest Support Levels:
- S1 – 1.2573
- S2 – 1.2451
Nearest Resistance Levels:
- R1 – 1.2695
- R2 – 1.2817
- R3 – 1.2939
Trading Recommendations:
The GBP/USD currency pair maintains a bearish trend but continues to correct. We still do not consider long positions, as we believe that the market has already priced in all the factors driving the British currency's growth multiple times. If you are trading based on "pure technicals," long positions are possible with a target of 1.2817 if the price consolidates above the moving average line. However, short positions remain much more relevant now, with targets at 1.2573 and 1.2480.
Explanation of Illustrations:
Linear Regression Channels help determine the current trend. If both channels are aligned, it indicates a strong trend.
Moving Average Line (settings: 20,0, smoothed) defines the short-term trend and guides the trading direction.
Murray Levels act as target levels for movements and corrections.
Volatility Levels (red lines) represent the likely price range for the pair over the next 24 hours based on current volatility readings.
CCI Indicator: If it enters the oversold region (below -250) or overbought region (above +250), it signals an impending trend reversal in the opposite direction.
 English
 Русский
 Bahasa Indonesia
 Bahasa Malay
 ไทย
ไทย Español
 Deutsch
 Български
 Français
 Tiếng Việt
 中文
中文 বাংলা
বাংলা हिन्दी
 Čeština
 Українська
 Română

