The EUR/USD currency pair has essentially stopped trading and remains stagnant. Volatility has fallen to near-zero levels, prompting speculation that the market has effectively closed its books for 2024, opting to wait for the calm of the Christmas and New Year holidays. It's not unusual for market volatility to decline as the year-end approaches, but in this case, the drop has come unusually early.
Yesterday, the Eurozone released its inflation report, revealing a final November Consumer Price Index (CPI) of 2.2%, down from the initial estimate of 2.3%. While we had anticipated no market reaction due to the rarity of discrepancies between initial and final estimates, this time, the numbers differed. This discrepancy provided a valid reason for the market to sell the euro, as it further increased the likelihood of swift and decisive monetary easing by the European Central Bank.
Typically, the lower the inflation rate, the higher the likelihood of continued central bank rate cuts. However, the market ignored this report despite the theoretical possibility of the ECB lowering rates below the elusive "neutral level." With each passing day, it becomes increasingly evident that trading for this year is effectively over—or at least rational and logical trading. In a thin market, abrupt price spikes are more likely, but these movements are extremely difficult to predict.
The Federal Reserve meeting undoubtedly sparked some market emotions, but this article will not delve into the meeting itself, its outcomes, or the market's immediate reactions. As we've noted repeatedly, the market typically takes at least a full day to digest such significant events fully. It's common for volatility to spike in one direction following a central bank decision, only for the price to retrace to its initial levels within 10–15 hours. For this reason, we consistently caution against drawing hasty conclusions.
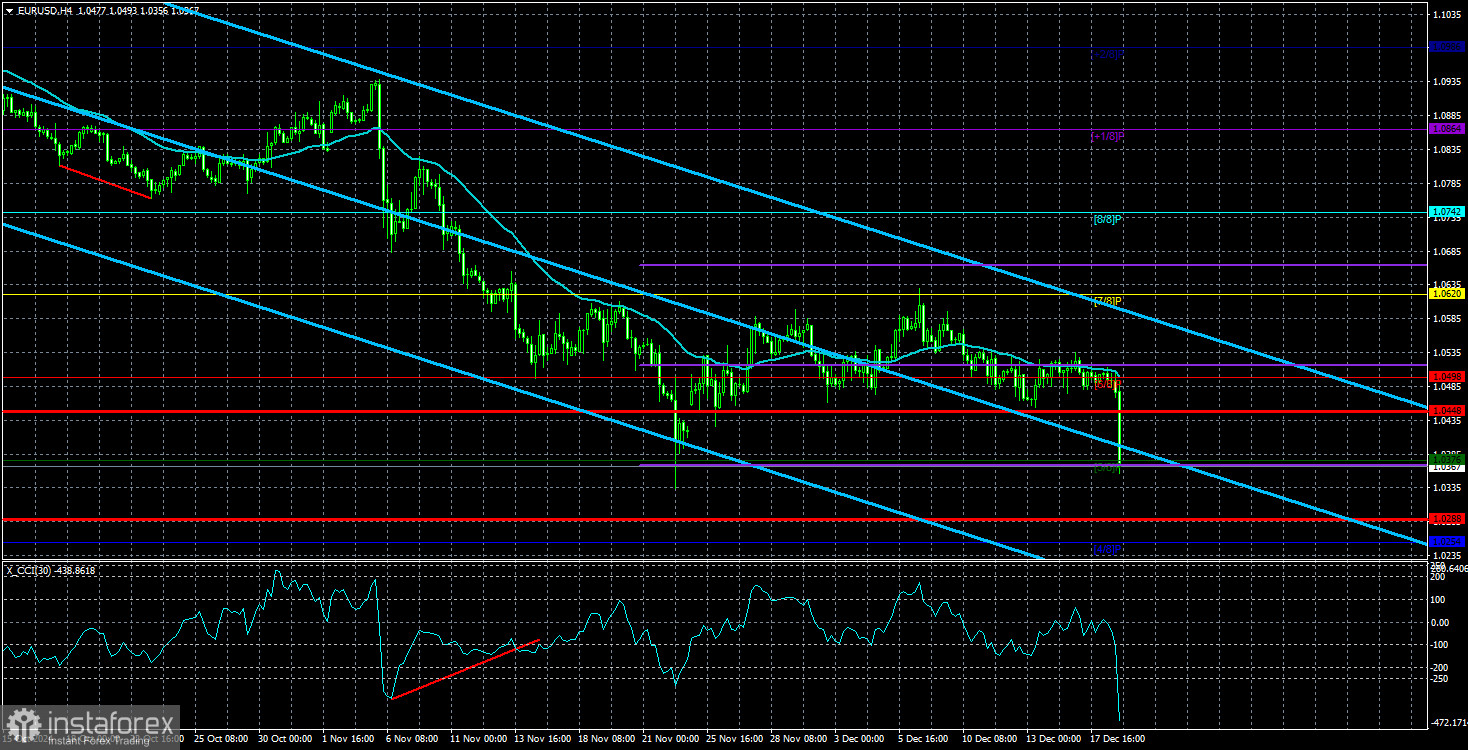
The downward trend persists in both the short and long term. Corrections or sideways movements could last for another one, two, or even three weeks, but they will not alter the overall trajectory. Only major fundamental events or structural changes capable of driving the euro up by 1,000–1,500 pips would signal the end of the bearish trend. We currently see no catalyst capable of propelling the euro at such a significant upward distance.

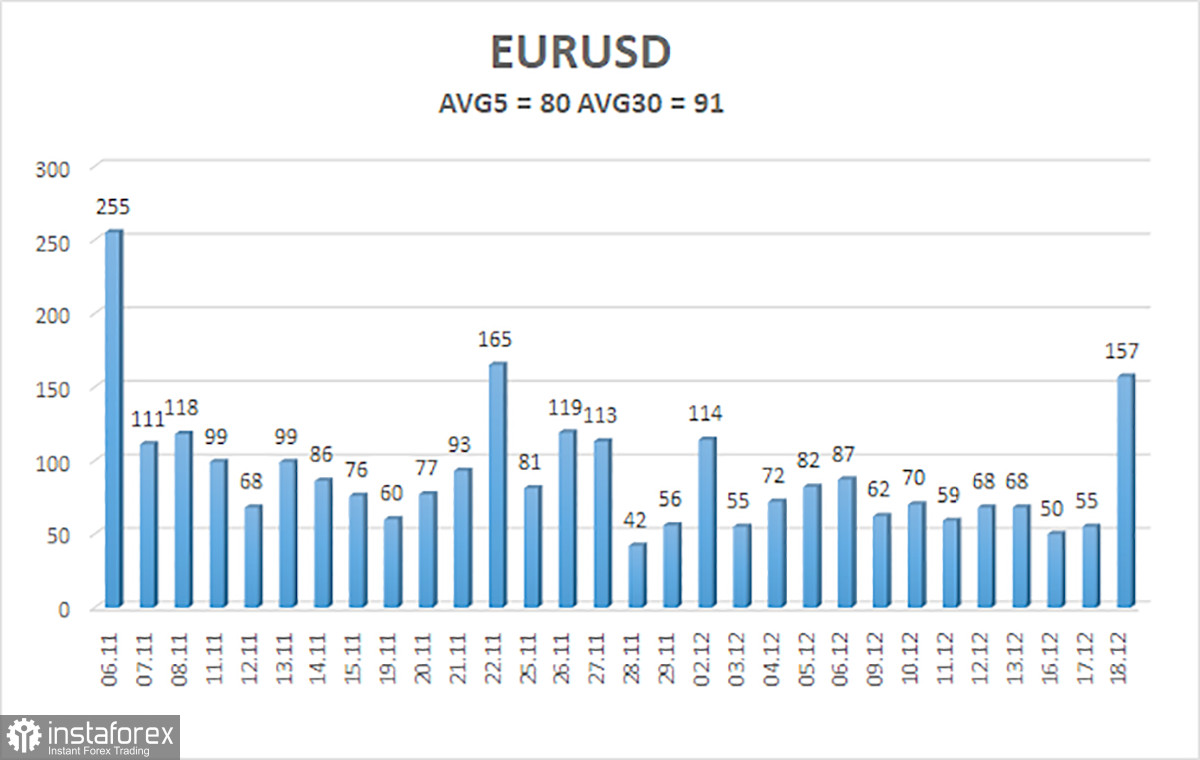
The average volatility of the EUR/USD currency pair over the last five trading days as of December 19 is 60 pips, classified as "moderate." We expect the pair to move between the levels of 1.0288 and 1.0448 on Thursday. The higher linear regression channel remains downward-sloping, signaling the continuation of the global downtrend. The CCI indicator has again entered the oversold zone amid sharp declines, warning of a potential correction at best.
Key Support Levels:
- S1: 1.0376
- S2: 1.0254
- S3: 1.0132
Key Resistance Levels:
- R1: 1.0498
- R2: 1.0620
- R3: 1.0742
Trading Recommendations:
The EUR/USD pair can resume its downtrend at any moment. Over the past few months, we have consistently anticipated declines in the euro over the medium term, and we fully support the overall bearish trend direction. There is a high likelihood that the market has already priced in most, if not all, of the future Fed rate cuts. As a result, the dollar continues to lack substantial reasons for medium-term depreciation, as it did in previous months.
Short positions remain relevant with targets at 1.0288 and 1.0254 as long as the price remains below the moving average. If trading purely on "pure" technical analysis, long positions may be considered if the price rises above the moving average, with a target of 1.0620. However, we do not recommend long positions to anyone at this stage.
Explanation of Illustrations:
Linear Regression Channels help determine the current trend. If both channels are aligned, it indicates a strong trend.
Moving Average Line (settings: 20,0, smoothed) defines the short-term trend and guides the trading direction.
Murray Levels act as target levels for movements and corrections.
Volatility Levels (red lines) represent the likely price range for the pair over the next 24 hours based on current volatility readings.
CCI Indicator: If it enters the oversold region (below -250) or overbought region (above +250), it signals an impending trend reversal in the opposite direction.
 English
 Русский
 Bahasa Indonesia
 Bahasa Malay
 ไทย
ไทย Español
 Deutsch
 Български
 Français
 Tiếng Việt
 中文
中文 বাংলা
বাংলা हिन्दी
 Čeština
 Українська
 Română

