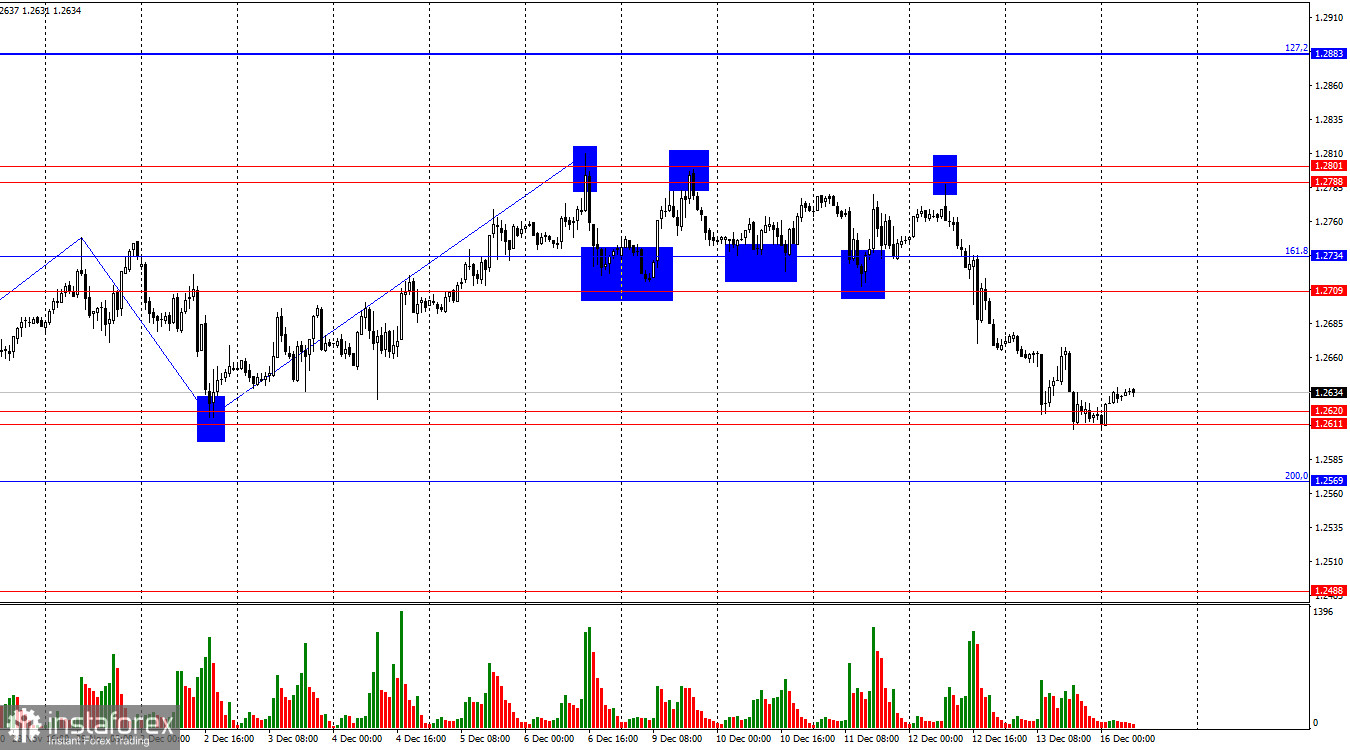
On the hourly chart, GBP/USD continued its downward movement on Friday, reaching the support zone of 1.2611–1.2620. A rebound from this zone could favor the British pound and prompt some growth toward the resistance zone of 1.2709–1.2734. A breakout below the support zone would open the path for further declines toward the levels of 1.2569 and 1.2488.

The wave structure leaves no room for doubt. The last upward wave broke the previous peak, but the current downward wave has not yet breached the previous low. Formally, the "bullish" trend remains intact. However, I believe this trend may already be weak or even completed. Over the past few days, there have been numerous precise signals. For a new "bearish" trend to begin, the price must close below the zone of 1.2611–1.2620.
Friday's economic data for the pound was highly significant but brought no optimism. The UK GDP report for October showed a negative reading, and the industrial production report was also disappointing. As a result, there was no incentive for bulls to take active action during the day. The pound was fortunate to hold above the 1.2611–1.2620 zone by the end of the day. However, bears are likely to maintain pressure this week, especially if the news supports them.
This week will be eventful. Today, both the UK and US will release PMI data, but the highlight will be the Federal Reserve and Bank of England meetings on Wednesday and Thursday, respectively. The UK will also release its inflation report, while the US will publish its GDP data. For bulls, holding the 1.2611–1.2620 zone is critical. If they fail, the trend will likely shift to "bearish." The outcome depends on the news flow, so close attention to economic updates is essential this week.

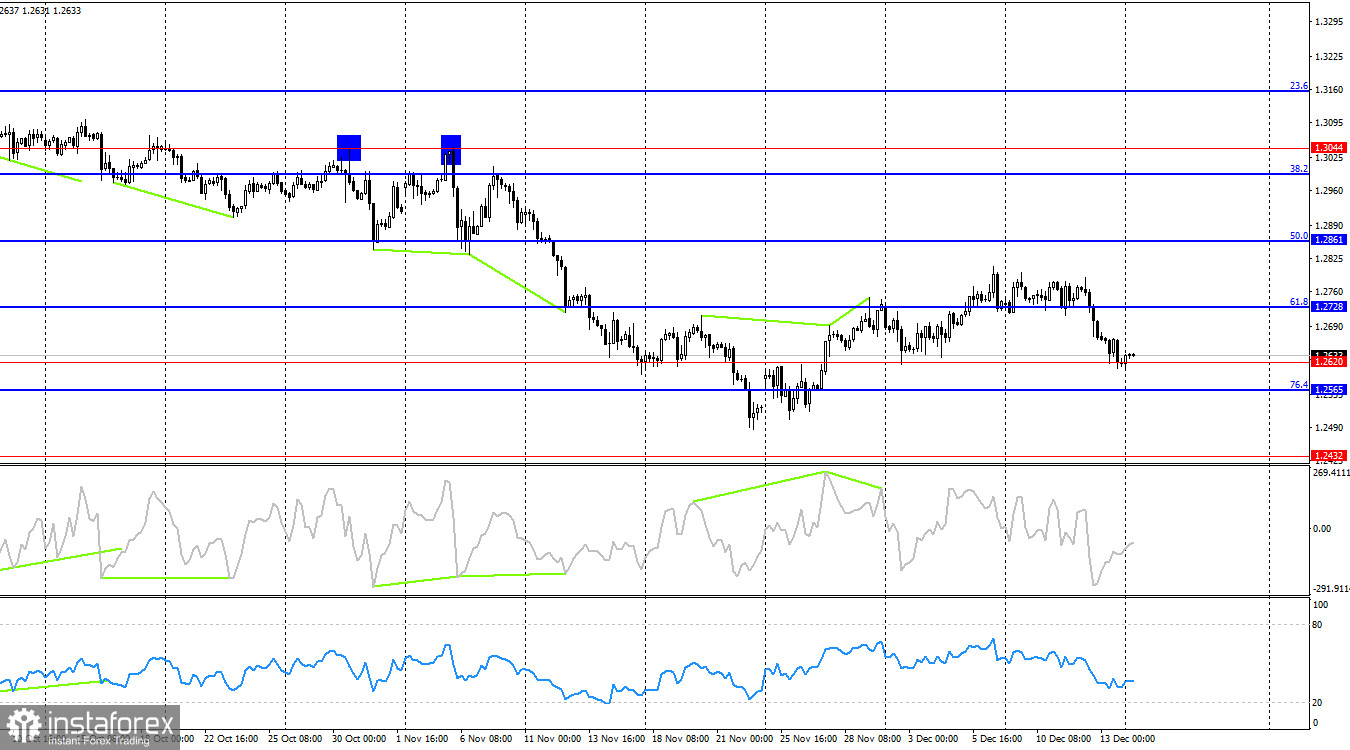
On the 4-hour chart, GBP/USD reversed in favor of the US dollar, broke below the 61.8% Fibonacci retracement level at 1.2728, and fell to 1.2620. The 1.2620 level aligns with the hourly chart, suggesting a potential rebound from this level. Overall, the trend on the 4-hour chart remains "bearish," supporting expectations for continued declines toward 1.2432.
Commitments of Traders (COT) Report

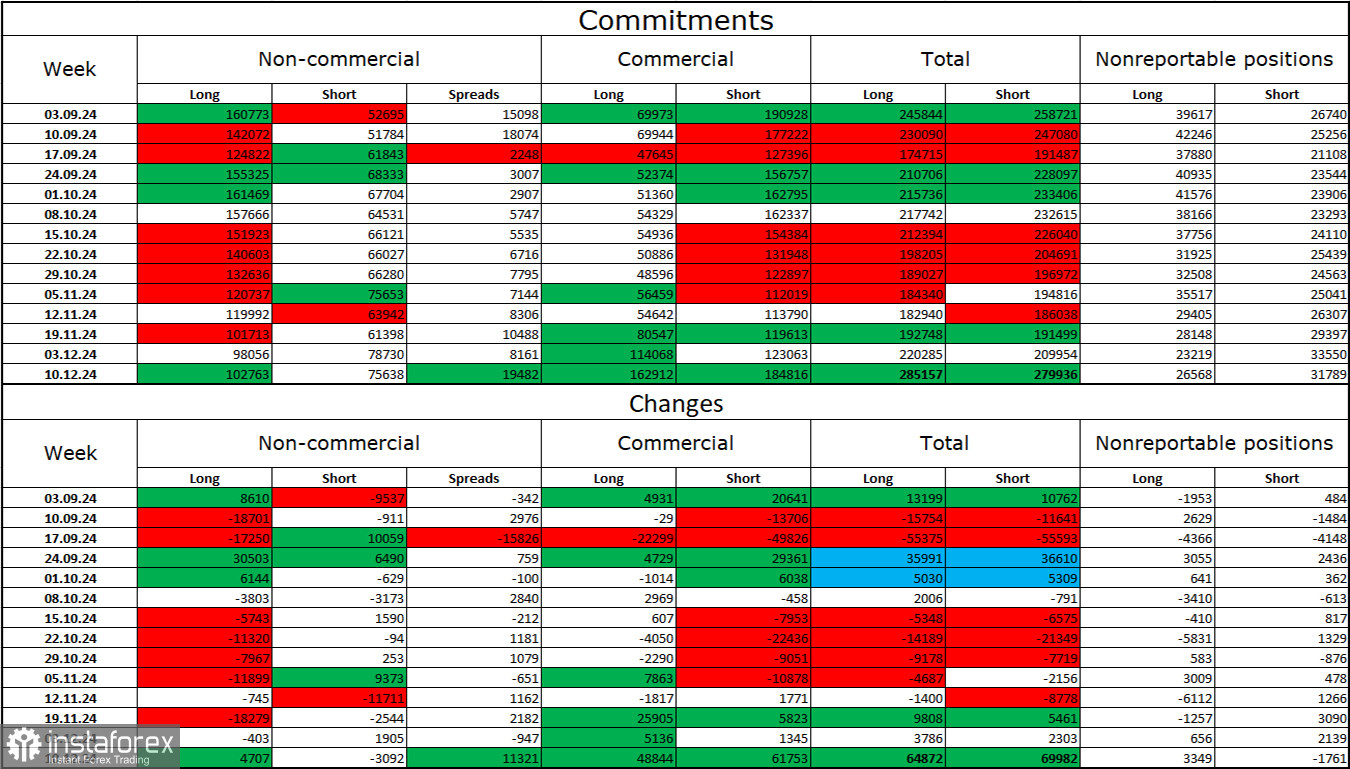
The sentiment of the "Non-commercial" category remained relatively unchanged during the last reporting week. Long positions increased by 4,707 contracts, while short positions decreased by 3,092 contracts. Bulls still hold the advantage, but it has been declining over the past few months. The gap between long and short positions is now just 27,000: 102,000 versus 75,000.
In my view, the pound still has room for further declines. COT reports consistently signal strengthening bearish positions nearly every week. Over the last three months, long positions have fallen from 160,000 to 102,000, while short positions have risen from 52,000 to 75,000. I believe professional players will continue to reduce longs or increase shorts as most potential drivers for the pound's rise have already been priced in. Graphical analysis also supports a bearish outlook.
Economic Calendar for the UK and US
- UK: Services PMI (09:30 UTC)
- UK: Manufacturing PMI (09:30 UTC)
- US: Services PMI (14:45 UTC)
- US: Manufacturing PMI (14:45 UTC)
Monday's economic calendar features four key releases, each of which holds some significance. The overall impact of the news on market sentiment is expected to be moderate.
Forecast and Trading Recommendations for GBP/USD
Selling opportunities were viable following a rebound from the 1.2788–1.2801 level on the hourly chart, targeting 1.2709–1.2734. Sales were also appropriate after a break below the 1.2709–1.2734 zone, targeting 1.2611–1.2620, with all targets reached. Currently, I would avoid considering buying opportunities, though a rebound from the 1.2611–1.2620 zone could lead to a slight upward correction.
Fibonacci Levels:
- Hourly Chart: Built between 1.3000–1.3432
- 4-Hour Chart: Built between 1.2299–1.3432
 English
 Русский
 Bahasa Indonesia
 Bahasa Malay
 ไทย
ไทย Español
 Deutsch
 Български
 Français
 Tiếng Việt
 中文
中文 বাংলা
বাংলা हिन्दी
 Čeština
 Українська
 Română

