As anticipated, the EUR/USD currency pair continued its downward movement on Thursday. Yesterday marked the year's final European Central Bank meeting, yet no surprises were expected. There was a slight chance of a 0.5% key rate cut, which was unlikely from the start. Thus, the ECB made the decision everyone had been expecting. While this event seemingly triggered a new decline in the euro, the reality is more complex. Let's delve into it.
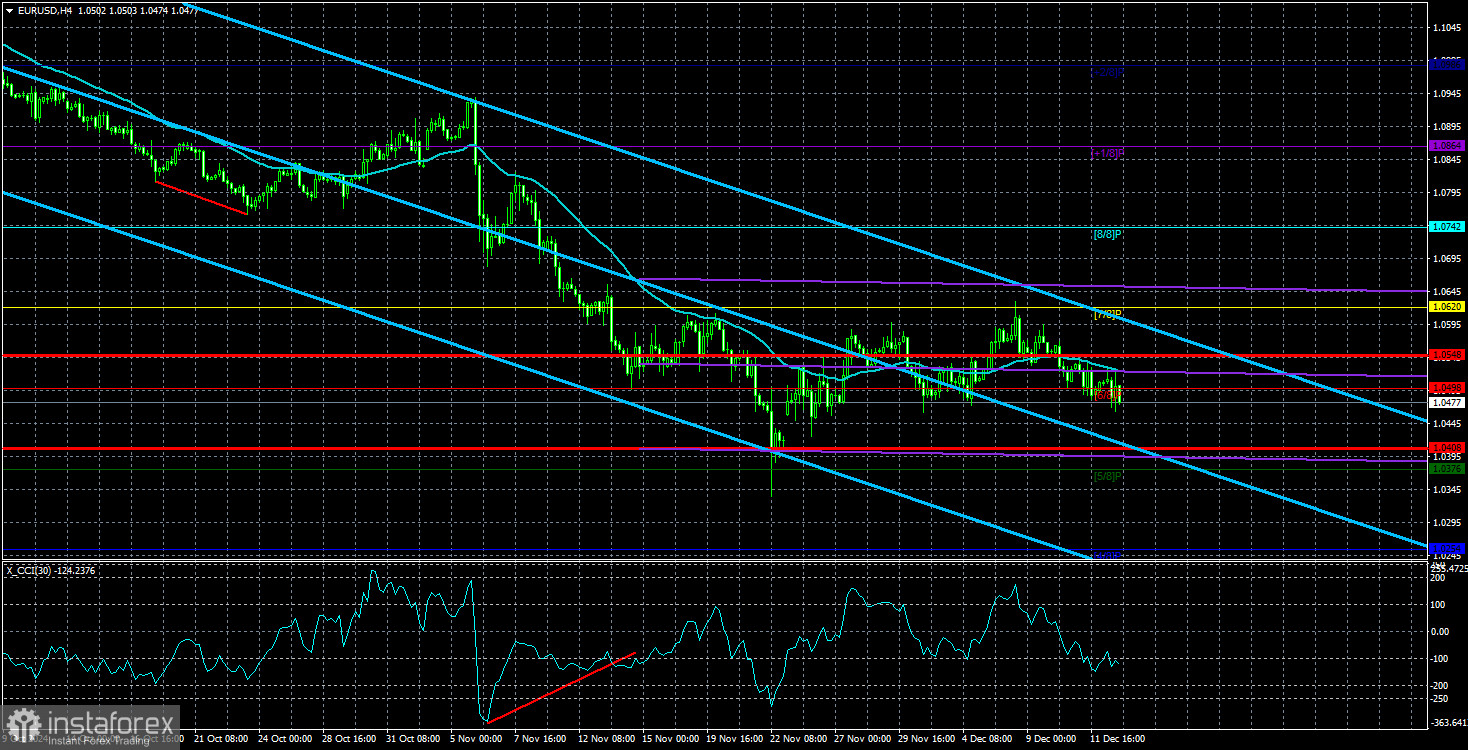
For nearly three months, the euro has been in a clear downtrend. Any upward movement during this time has been purely corrective. Since the pair corrected for two weeks, this was sufficient to expect a resumption of the downtrend. On the hourly timeframe, a clear range has been observed in recent weeks, with the latest bounce occurring off the upper boundary. As a result, traders could anticipate a move toward the lower boundary.
The market was anticipating two scenarios from the ECB: a 0.25% rate cut or a more aggressive 0.5% cut. As mentioned, the latter was unlikely. Therefore, the market had already priced in a 0.25% cut. When the decision was announced, it was largely expected and had already been factored into the market. Naturally, monetary policy easing is a bearish factor for the national currency, but in this case, it wasn't the decisive one. The euro was likely to continue falling regardless of the ECB's meeting.
Global fundamental factors have remained unchanged for a long time. The ECB is cutting rates faster than the Federal Reserve, even though at the start of the year, market participants expected aggressive action from the Fed and were skeptical about the ECB. However, as we warned in the spring, the reality was the opposite. While inflation was a key issue, the EU economy has struggled with growth for two years, necessitating monetary policy easing. As a result, the ECB has been cutting rates at nearly every meeting, while the Fed has been more measured and has the luxury of waiting, given the U.S. economy's consistent 3% quarterly growth.
Additionally, the dollar depreciated during the period when U.S. inflation was slowing. It's clear that the market had been pricing in future Fed rate cuts in advance. Therefore, the speed of the Fed's rate cuts now matters less—the dollar should continue to strengthen, even if it appears paradoxical.
The technical picture is also clear, especially in terms of the weekly timeframe. If the price exits the range on the hourly timeframe and starts a new downward leg on the 4-hour chart, it could break below the 2-year consolidation range on the weekly chart. This would indicate a high probability of a renewed downtrend on the weekly timeframe, with targets extending toward the 0.95 level.

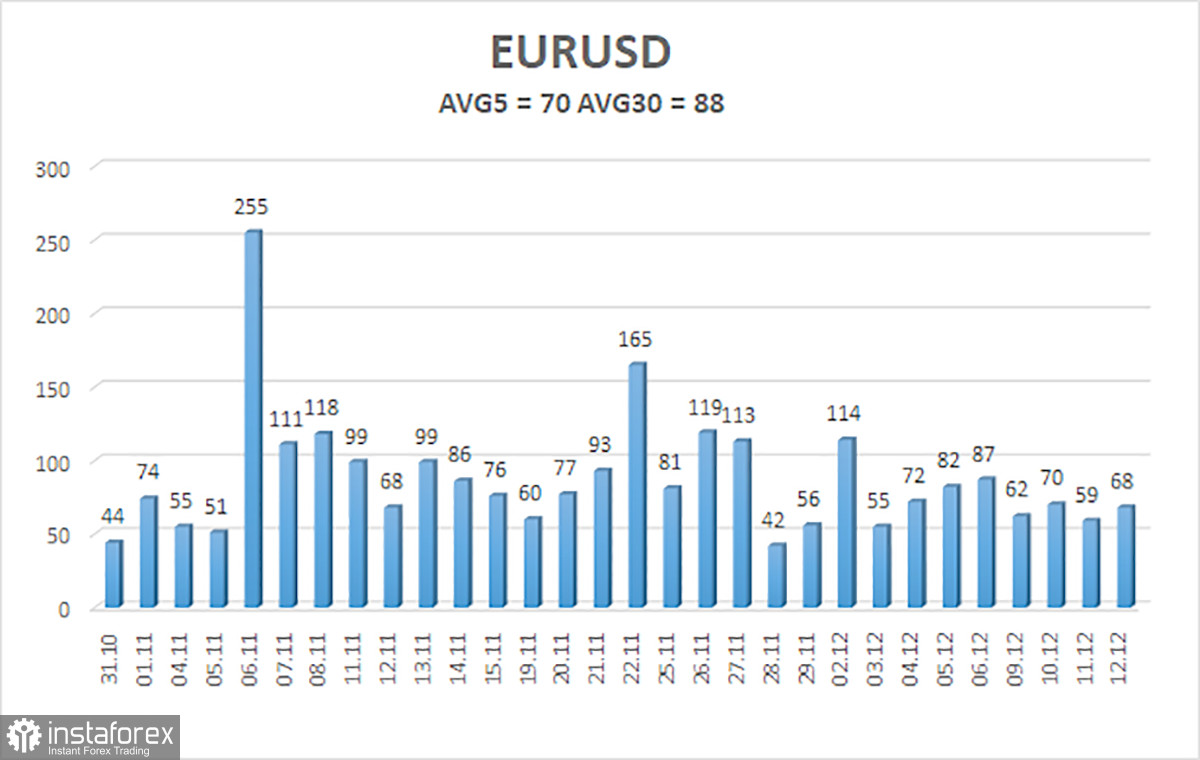
The average volatility of the EUR/USD currency pair over the last five trading days as of December 13 is 70 pips, classified as "average." We expect the pair to move between 1.0408 and 1.0548 on Friday. The higher linear regression channel is directed downward, indicating that the global downtrend remains intact. The CCI indicator has entered the oversold area several times, triggering a correction that is still ongoing.
Nearest Support Levels:
- S1: 1.0376
- S2: 1.0254
- S3: 1.0132
Nearest Resistance Levels:
- R1: 1.0498
- R2: 1.0620
- R3: 1.0742
Trading Recommendations:
The EUR/USD pair can resume its downtrend at any moment. Over recent months, we have consistently stated that we expect the euro to decline in the medium term and fully support the overall bearish trend direction. There is a high probability that the market has already priced in most, if not all, of the expected future Fed rate cuts. If this is the case, the dollar still has little reason for medium-term weakening, as was the case previously.
Short positions can be considered with targets at 1.0408 and 1.0376 if the price remains below the moving average. If you are trading using "pure" technical analysis, long positions can be considered when the price is above the moving average, with targets at 1.0620 and 1.0636. However, we do not recommend long positions at this time.
Explanation of Illustrations:
Linear Regression Channels help determine the current trend. If both channels are aligned, it indicates a strong trend.
Moving Average Line (settings: 20,0, smoothed) defines the short-term trend and guides the trading direction.
Murray Levels act as target levels for movements and corrections.
Volatility Levels (red lines) represent the likely price range for the pair over the next 24 hours based on current volatility readings.
CCI Indicator: If it enters the oversold region (below -250) or overbought region (above +250), it signals an impending trend reversal in the opposite direction.
 English
 Русский
 Bahasa Indonesia
 Bahasa Malay
 ไทย
ไทย Español
 Deutsch
 Български
 Français
 Tiếng Việt
 中文
中文 বাংলা
বাংলা हिन्दी
 Čeština
 Українська
 Română

