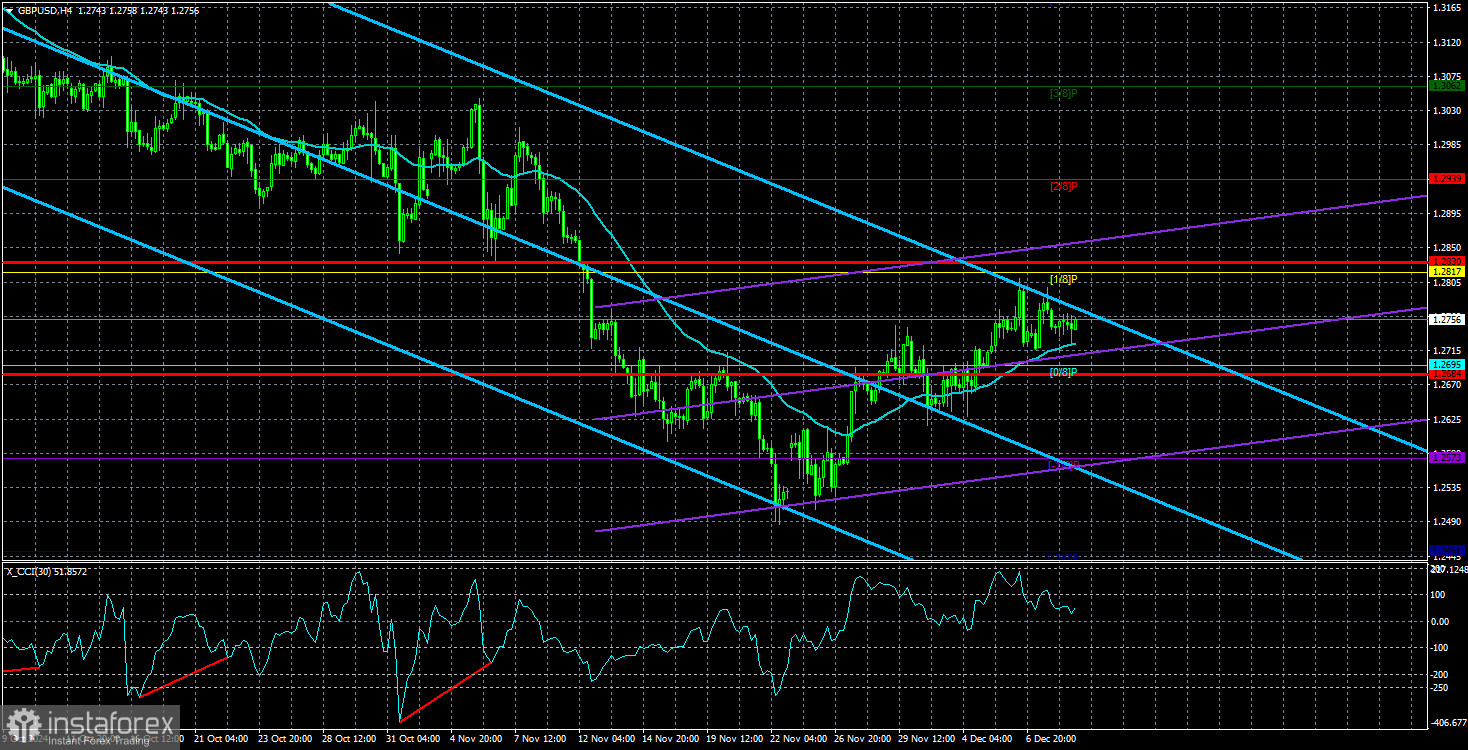
The GBP/USD currency pair remains above the moving average line, indicating that the local upward trend remains intact. However, we have repeatedly reiterated that any growth in the British pound at this stage is merely a correction, and we maintain this stance. After two consecutive months of decline, the pound is simply experiencing a pause. As previously noted, corrective movements can last for weeks or even months, as they are typically slower and less impulsive than trend movements. Simply put, prices drop or rise rapidly, then consolidate or move sideways in a correction or flat phase. Major players often use these periods to accumulate positions ahead of the next significant move.
Unless you're trading intraday, where positions are opened and closed quickly, it is generally advisable to mimic the strategies of major players. Of course, every trader cannot predict their actions and hold positions for weeks while waiting for the price to move in their favor. However, this is how the Forex market operates, regardless of individual preferences. At the moment, the British pound could easily enter a sideways movement or correct slightly higher. However, the daily timeframe suggests the beginning of a new downward trend, while the weekly timeframe indicates the continuation of the long-term bearish trend. The price has reached the critical line on the daily timeframe, from which it may rebound.
We continue to believe that the British pound will resume its decline. However, two key events could disrupt this: If the Federal Reserve lowers its key interest rate by 0.5%, it could significantly weaken the U.S. dollar. If the Bank of England adopts an unexpectedly hawkish stance, it could support the pound. That said, the market is not expecting a rate cut from the BoE and is anticipating a 0.25% rate cut from the Fed. These scenarios have already been priced in, as anticipated, for weeks. It is highly unlikely that the Fed will cut rates by 0.5%, given that numerous FOMC members have repeatedly emphasized that there is no need to rush. Similarly, the BoE is unlikely to take a hawkish stance when Governor Andrew Bailey recently mentioned four rate cuts expected in the next year.
From our perspective, the situation offers little room for optimism for the pound. No matter how we analyze the circumstances, we find no compelling reasons for sterling to rise soon. However, traders can use the Kijun-sen line in the 24-hour timeframe as a key reference point. If the price breaks above this line, further correction may be expected. While we cannot recommend buying at this time—fully aware that the current movement is corrective—it is worth noting that this correction could last another month.

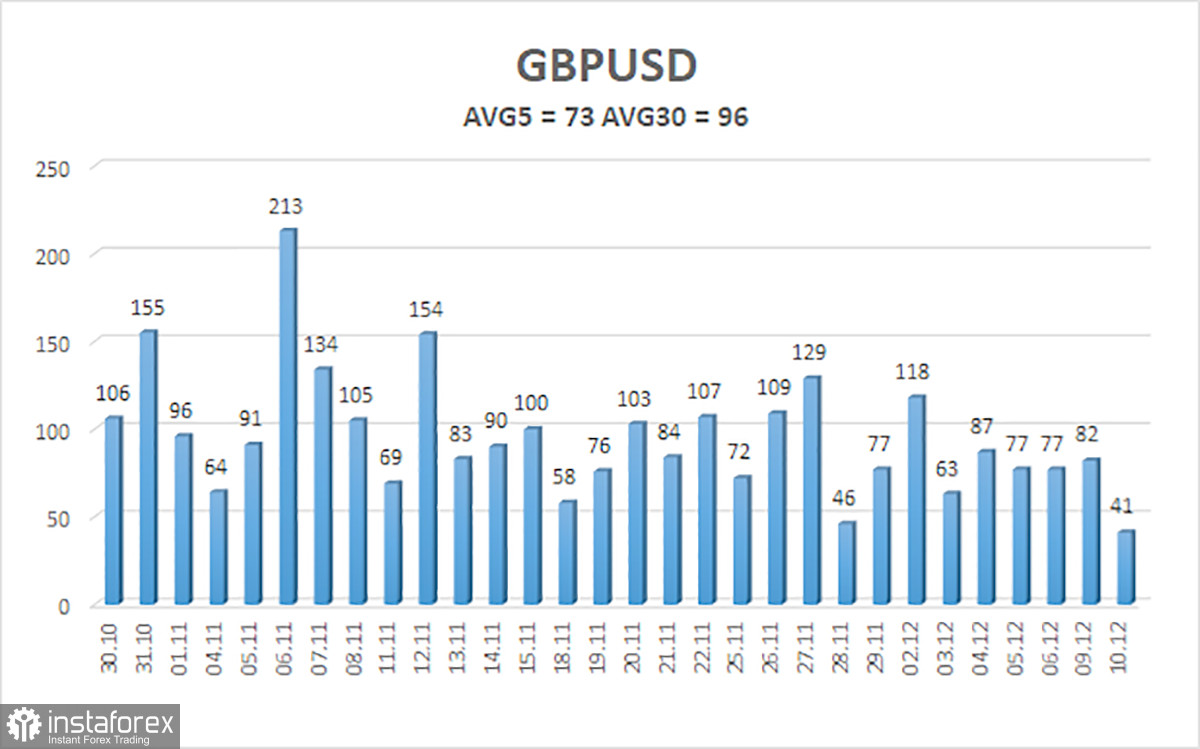
The average volatility of the GBP/USD pair over the past five trading days is 73 pips, which is classified as "average." On Wednesday, December 11, we expect the pair to trade within a range defined by 1.2684 and 1.2830. The higher linear regression channel is pointing downward, signaling a prevailing downtrend. The CCI indicator has formed multiple bullish divergences and entered the oversold zone several times, indicating that the correction is ongoing, though its strength remains difficult to predict.
Support Levels:
- S1: 1.2695
- S2: 1.2573
- S3: 1.2451
Resistance Levels:
- R1: 1.2817
- R2: 1.2939
- R3: 1.3062
Trading Recommendations:
The GBP/USD pair maintains a downward trend, though the correction continues. We are not considering long positions now, as we believe the market has already priced in all factors supporting the pound's growth multiple times. For traders relying on pure technical analysis, long positions could be considered with targets at 1.2817 and 1.2830, provided the price remains above the moving average line. However, short positions are more relevant in the current environment, targeting 1.2573 if the price breaks below and consolidates under the moving average. The pair will likely remain influenced by broader trends and corrections in the near term.
Explanation of Illustrations:
Linear Regression Channels help determine the current trend. If both channels are aligned, it indicates a strong trend.
Moving Average Line (settings: 20,0, smoothed) defines the short-term trend and guides the trading direction.
Murray Levels act as target levels for movements and corrections.
Volatility Levels (red lines) represent the likely price range for the pair over the next 24 hours based on current volatility readings.
CCI Indicator: If it enters the oversold region (below -250) or overbought region (above +250), it signals an impending trend reversal in the opposite direction.
 English
 Русский
 Bahasa Indonesia
 Bahasa Malay
 ไทย
ไทย Español
 Deutsch
 Български
 Français
 Tiếng Việt
 中文
中文 বাংলা
বাংলা हिन्दी
 Čeština
 Українська
 Română

