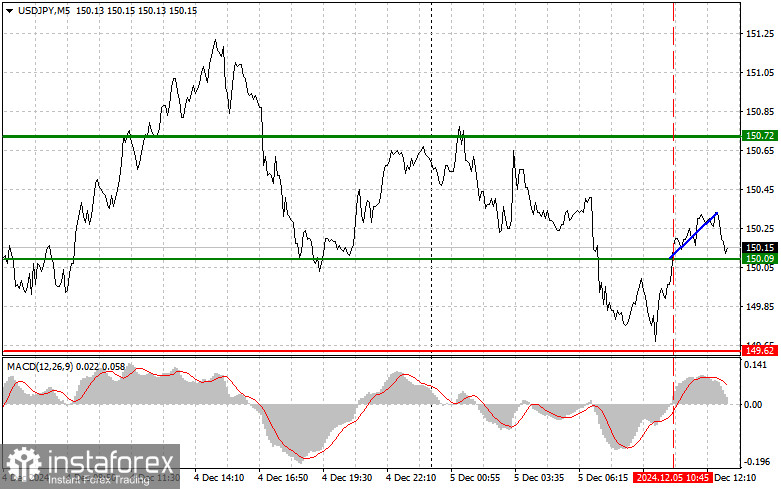
Analysis of Trades and Trading Advice for the Japanese YenThe test of the 150.09 level coincided with the MACD indicator beginning to rise from the zero line, confirming a valid entry point to buy the dollar and take advantage of the upward trend. As a result, the pair rose by about 30 points.
Weekly U.S. initial jobless claims data are unlikely to significantly impact the current market, as economists consider them a secondary labor market indicator. Their short-term nature and seasonal adjustments make them less reliable for long-term predictions. It would be better to focus on tomorrow's November unemployment report for the U.S. and avoid making major decisions today. For intraday strategy, I will focus on implementing Scenarios 1 and 2.

Buy Signal
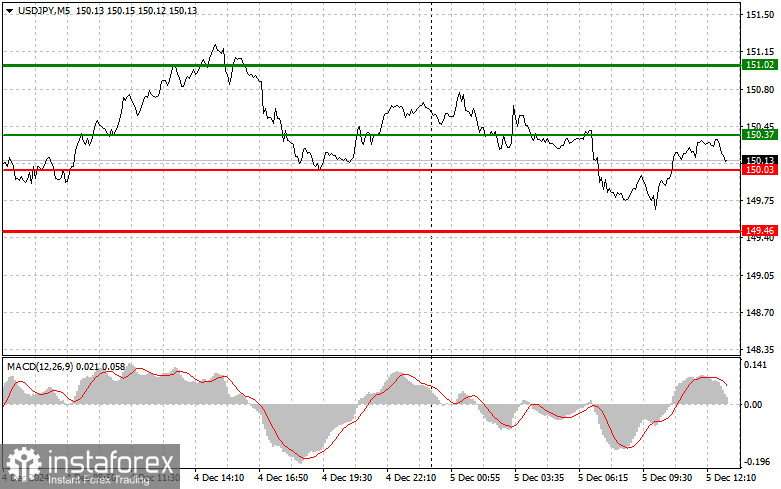
Scenario 1:Buy USD/JPY at 150.37 (green line on the chart); aim for a rise to 151.02 (thicker green line on the chart). At 151.02, close long positions and open short positions, expecting a 30-35 point pullback. The pair is likely to rise only if the data is very strong.Note: Before buying, ensure the MACD indicator is above the zero line and just beginning to rise.
Scenario 2:Buy USD/JPY if there are two consecutive tests of 150.03 while the MACD indicator is in the oversold zone. This should limit the pair's downward potential and prompt an upward reversal, targeting 150.37 and 151.02.
Sell Signal
Scenario 1:Sell USD/JPY after breaking below 150.03 (red line on the chart); aim for a decline to 149.46. At 149.46, close short positions and open long positions, expecting a 20-25 point pullback. The higher the upward corrections, the greater the likelihood of renewed selling pressure on the pair.Note: Before selling, ensure the MACD indicator is below the zero line and just beginning to decline.
Scenario 2:Sell USD/JPY if there are two consecutive tests of 150.37 while the MACD indicator is in the overbought zone. This should limit the pair's upward potential and trigger a downward reversal, targeting 150.03 and 149.46.

Chart Notes
- Thin green line: Entry price for long positions.
- Thick green line: Target price for setting Take Profit or manually closing trades, as further growth above this level is unlikely.
- Thin red line: Entry price for short positions.
- Thick red line: Target price for setting Take Profit or manually closing trades, as further declines below this level are unlikely.
- MACD Indicator: Focus on the MACD's overbought and oversold zones when entering trades.
Important Note for Beginner Traders
Beginner Forex traders should approach market entries with caution. Avoid trading during the release of significant reports to minimize exposure to sharp price fluctuations. If you choose to trade during news events, always use stop-loss orders to limit potential losses. Without stop-losses and proper money management, you risk rapidly depleting your account, especially when trading large volumes.
A clear trading plan, like the one outlined above, is essential for success. Spontaneous trading decisions based on the current market situation often lead to unfavorable outcomes for intraday traders.
 English
 Русский
 Bahasa Indonesia
 Bahasa Malay
 ไทย
ไทย Español
 Deutsch
 Български
 Français
 Tiếng Việt
 中文
中文 বাংলা
বাংলা हिन्दी
 Čeština
 Українська
 Română

